› Fora › ASTRO-FORUM › GENEREL ASTRONOMI › V339 Del, NYT 29/10 – billeder af novaens ildkugle
- Dette emne har 76 svar og 9 stemmer, og blev senest opdateret for 9 år, 4 måneder siden af nightsky. This post has been viewed 2846 times
-
ForfatterIndlæg
-
8. september 2013 kl. 22:42 #106708
nightskyDeltager- Neutron star
Artikel 8 fra Steven Shore. Hvad vi kan forvente, De gamle Payne-Gaposchkin’s data, lidt
tips m.m.An observation with the NOT has been requested for 7 Sept. (Saturday-Sunday) with the aim
of providing a second, independent calibration of all of your data and get another very
high resolution observation of the absorption features. The Na I velocities have remained
almost stationary but that may be a resolution effect. Two spectra, 10 sec and 1000 sec
have been requested. As I wrote, the agreement overall is excellent.Once the nova is below V ~ 8 we will be getting Swift UVOT data and as soon as the XR
source turns on we’ll schedule Chandra (pre-approved).We still have time for this period with NOT for three spectra, the next sequence starts
in Oct.-Apr. and a proposal is due for 30 Sept. for the period thereafter.On the PI business, this is a relic of the proposal process at major facilities and
mainly because of proprietary practices. The same is true for Swift, they use the term
but we all know it’s fake because the data is immediately public. It should be
“Investigation leader” or something like that but the term was imported from other
observatories (e.g. HST, Chandra) where the data has a period of restricted access.If the German group wants to keep their data that’s fine. It can’t be better than what
you’ve all produced.Update: German group = VdS SPEKTROSKOPIE Fachgruppe
Pro/Am kampagne med observation af Wolf-Rayet stjernerne WR 134,135 og 137.
83 amatører og professionelle er involveret i projektet, bl.a. Knud Strandbæk AAF.
Der observeres hver nat over flere måneder fra IAC 80 på Teide
Teide holdene har haft mulighed for enkelte observationer af Nova Del 2013 uden at det
ødelægger WR kampagnen
Gruppens DATA er netop kommet med, heldigvis blev de små problemer løstAs a general comment about what can be done now — the rise and early decline would be
the key here, to cover the physics of the stage relative to other novae for which we have
the UV and emphasize the developments in the optical. For this using the low resolution
data is essential for coverage of the continuum and showing the relation with classical
observations (e.g. sequences of the spectra as images or, better, surface plots).The continuum can be normalized “backwards” in time by using the available photometry so
the energy budget can be studied with the high resolution data showing the profile
variations and velocities. The sequences you’ve all produced showing the “retreat” of the
absorption on Halpha and the disappearance of the He I 5876,6678 lines are fantastic and
the lower resolution measurements can be directly compared with novae in the literature
from the days of photographic spectra. The density of coverage rivals a *very) few bright
20th century novae (I can recall Kepler myself!) done with photographic plates; my
thought for a project for anyone who might like to try it is to simulate what those
observers were measuring to see if it’s possible to calibrate their velocity curves. It’s
never been possible. Keep in mind that those characters were making microscope
measurements, or at best taking tracings (until the invention of the Grant machine).
comparing spectra with standards to get line displacements. It was very skilled but
subjective and individual plate quality varied far more than your data.I was trying to reason one thing out today. The dispersion is not always discussed in
Payne-Gaposchkin’s compilation and for many I haven’t gone back through the literature to
see when the switch was made in different spectrographs and plate material. Those before
1940 were frequently prism spectra (at least at Lick and McDonald) so have the problem of
variable dispersion. The emulsions were usually rather coarse-grained, like Kodak 103aO
or AGFA, with grains of order 20-50 microns. Since the typical dispersion was 50 -100
A/mm, this amounts to 1-10 A/pixel equivalent; at H-beta this is 150-300 km/s per
resolution element (2 px). You see that even the low resolution data is of the same order
in the current database, and for photographic plates the maximum S/N ratio was never much
better than 20. You have, in some cases, 100 or better. So for these data even the lowest
resolution spectra provide information on the short timescale variations that none of the
classical studies could show. The coverage of the various “flash” stages can be used to
understand what the descriptions in the literature mean, this includes data from the ’60s.And the time coverage is denser than I think has ever been obtained for any nova, nearly
continuous. So time series will be possible, for instance to look for short time
variations across the profiles (not just integrated values!).One last thing. Thinking about exposures and calibrations, since we’re now about one
month (2 hrs LST) later, I should mention a caution.Nogle vigtige tips
When your exposures are getting long, say one hour, for any object and it’s at high
zenith angle (high air mass), site change sin atmospheric absorption lines change the
line profiles. This is also a problem for the absolute calibrations. If you’re observing
a source at high air mass, and you have the time, it’s useful to get a standard at the
start and end of the exposure, no matter what you’re doing. Near the meridian this isn’t
a problem but since the atmosphere changes exponentially as you go away from that area
the structure (not just slope) of the continuum changes. For example, at [O I] 6300 and
H-alpha, water vapor bands sit on features that are possibly real in the profiles and you
need to be careful that the same features don’t appear in the standard. But this doesn’t
mean removing them, it just calls for care. These also change over time, from site to
site, so the extensive network you’ve built up is vital for inter-comparison. It’s not
only a problem for high resolution, the bands have structure that’s marginally resolved
even in the lowest of your spectra.And this also changes the total flux, although for most lines < 6700A this isn’t a
serious problem. Remember that there’s water absorption even on Na I D, it is not only
confined to the red part of the spectrum, and when some emission lines appear (if they
do), like the [Ne III] doublet, these may have second order contributors in some spectra
depending on the spectrograph (e.g. [Ne V]3426). Alas, I have experience with this
problem.steve
Link:
Gratis download af denne klassiker:
Cecilia Payne-Gaposchkin:
The Galactic Novae Dover Publications Inc. 1964
http://archive.org/details/TheGalacticNovaeAlle data fra det fantastiske samarbejde kan hentes her:
http://www.astrosurf.com/aras/Aras_DataBase/Novae/Nova-Del-2013.htm
Uhyre nemt at arbejde med disse data. Download Visual Spec eller ISIS og du er i gang.9. september 2013 kl. 00:08 #106714
nightskyDeltager- Neutron star
Lidt aha oplevelser fra Tvis omkring støv, Novaer etc.
I starten af denne for mig utrolige rejse med Nova Del 2013, undrede jeg mig over opfordringen
til at holde øje med Cn linjen 4216Å for støv dannelse. Er der en sammenhæng mellem dette
støv og noget jeg har i Tvis?Så jeg rodede lidt rundt i det, bl.a. dette paper “Photo-Ionization Induced Rapid Grain
Growth in Novae” for at finde ud af hvorfor dette støv er så vigtigt. Selvfølgelig er det
vigtigt at vide hvad/hvorfor dette støv skabes, men er der vigtigere spørgsmål omkring
dette på en større skala? Interstellart støv, kometer, meteoritter, livets oprindelse?Jeg tog mig sammen og spurgte til det.
Svar (Har forsøgt at sammenfatte og oversætte efter bedste evne)
Dette er et delikat spørgsmål. Jeg vil besvare det på en næsten epistemologisk måde. Vi ser
på en fast fase, der overlever de interstellare betingelser der er til stede, selv i
supernovarester og aktive galaktiske kerner. Dannelsen af faste stoffer er svært nok i
laboratoriet, men så tænk på problemet med skydannelse. I atmosfæren er du næsten på
grænsen ved termisk ligevægt, og du kan stadig bruge en slags ”forståelige” begreber til
at modellere overgangen fast – gas, men det er ikke altid tilfældet. Hvad jeg mener er: i
termodynamik glemmer man alt om struktur og bare balancere mængder med mængderne i samme
volumen. Hvis der er noget mikroskopisk, antages det at tage et gennemsnit, og man ser
f.eks. kun på makroskopiske tætheder, tryk og temperaturer. Det er derfor, du ikke kan
sige, hvordan en dråbe vil se ud, men du kan sige, hvornår vandet vil kondensere. På den
anden side, i den øvre atmosfære (ligesom natlige højtliggende skyer og polære skyer)
dannelsen af is er typiske for kinetiske processer, diffusion og sammenlægning af klynger
dannet af kollisioner og tilvækst fra molekyler i miljøet.Det er ikke fordi du når en enkelt kritisk temperatur og “bum”
— Alting pludselig kondenserer (tænk på kondensations kamre). I stedet er den
gennemsnitlige energi af de kolliderende partikler lav nok til, at når de rammer
hinanden, kan de holde til det og ikke miste for mange andre atomer/molekyler/klynger.Vi ved at dannelsen af faste stoffer – støv – sker i de tidlige stadier af supernova
ekspansion. Det sker i massive stjerners vind, røde giganter og superkæmpes vinde, og –
har du det – Novae. At det kan observeres i realtid (vores Nova Del 2013) i et medium,
som vi grundigt kan angive er næsten et laboratorium test af idéer. Det er grunden til,
at støvdannelse er så vigtig.Men der er en anden, måske mere sublim grund, og jeg mener, at i en nærmest mystisk
forstand: i meteoritter vi finder pre-Sol korn/partikler, hvis sammensætninger vi mener
kommer fra røde super giganter, supernovaer og novaer. Der er særlige isotoper i disse
fragmenter, ofte kun 10 mikrometer eller mindre på tværs, isoleret inden for matricer.
Afhængigt af de omgivende temperaturer, sammensætninger, tætheder, forskellige
astrofysiske miljøer, vil der produceres forskellige isotoper Til dato er tre forskellige
sandsynlige kilder er blevet adskilt fra hinanden. Af disse en lille, men statistisk
signifikant antal er knyttet til novaer (som Nova Del 2013). De bedste artikler er af
Jordi Jose, Ernst Zinner, Andrew Davis, Christian Illiads, og der er en gruppe i Chicago
og en anden på Washington Univ. (US), der arbejder meget med dette problem.Et sidste problem er, at tilstedeværelsen af støv i planetariske atmosfærer er afgørende
for nogle køling og blandings processer. I ISM, er støvet en kondens miljø, der opbruger
metaller (noget fra CNO og op, Zn ikke inkluderet, interessant nok).Og det er den sidste grund
– Uden støv kan der ikke være dannelsen af molekylær brint.Dette svar bringer straks en videre til meteoritter som indeholder dette pre-Sol støv:
Allende
Murchison
Tagish Lake
Og mange flereEt foto fra samlingen – en stor oplevelse at kunne knytte en nova og de observationer jeg
laver med et ultra billigt instrument, sammen med meteoritter i min samling. I hånden kan
man holde og mærke et produkt af den voldsomme proces vi observer langt langt væk. En
proces som er med til at skabe betingelser for OS.
Fra en af Jordi Jose præsentationer:
Stellar Pyrotechnics: Classical Noave as Cataclysmic Events
http://pntpm3.ulb.ac.be/Trento/talks/pdf/jjose.pdf 11. september 2013 kl. 01:32 #106798
nightskyDeltager- Neutron star
En kort opdatering fra tirsdag d. 10 sep. Egne observationer.
En hurtig, ikke dark/bias/flat, kalibreret optagelse hvor Ha emissionen går i mætning.
Ioniseringen af jern ses ganske tydeligt.

En bedre analyser kommer senere.
11. september 2013 kl. 23:15 #106849
nightskyDeltager- Neutron star
ATel #5378

Artikel 9 fra Steven Shore
The light curve has caused some amusing impatience; it’s been amusing to see some of the
comments. It’s perhaps always good to remember that in an environment as complex as we must
have in these ejecta, as in other time dependent structures, unexpected things happen.
This brings to the fore a comment, in the hope it will put some of the present results in
perspective.The difference between a dynamical medium, like nova or supernova ejecta or even a
stellar wind, and a static structure — a stellar or planetary atmosphere — is “locality”.
An atmosphere is a very particular sort of medium, whether optically thick or thin (or
both).It’s a gas that is constrained to satisfy a mechanical equilibrium constraint, that the
run of pressure and temperature balance the effect of gravity (whether self-gravity or a
thin layer above a mass). The gradient with radius of the pressure and density must every-
where counterbalance an acceleration. If radiation pressure is important, this effectively
reduces the surface gravity but as long as it is low enough, the radiative
acceleration will not destabilize the medium. At the same time, since the equation of
state links the temperature, pressure, and density, and both are connected with the transfer
of radiation through the layer, the luminosity enters the picture in a relatively simple
way, at least in the sense that the radiation must pass from the interior to the outside
through a “surface” and ultimately the only loss is radiative (OK, no magnetic fields, no
neutrinos, just to be basic). As long as the luminosity stays roughly constant, and there
is a very clear definition of what this means, the atmosphere will have a unique static
structure. “Constant” means nothing changes faster than the thermal timescale of the
medium (the rate of cooling) or the sound travel time (which sets the condition for
hydrostatic — mechanical — balance. This doesn’t mean that the only parameters entering
the picture are the thermodynamic variables. The whole business is governed by the
abundance of the elements since the different elements have different ionization
energies, transition energies (lines), and different ionization states. The mix
collectively produces the opacity and that’s the key coupling between the radiation and
the matter. But if the medium is stable and static, there is a solution to its structure
and you can predict a spectrum emergent from the medium as a function of only a few
variables (OK, knowing the metallicity).A dynamic medium is a whole new problem. There’s no mechanical constraint to govern the
pressure and density. Those are imposed by the dynamics and depend on the driving. If the
medium is a wind, let’s be simple and take a steady outflow, then the condition that the
mass loss remains constant links the density and velocity at each distance from the star.
The mechanical requirement, that the velocity is determined by the driving, is the hard
part: you have to impose a mechanism (radiation, rotation, magnetic, whatever) that is
described by its own physical constraints, to determine the run of density with radius.
This, in turn, affects the ionization and — through that — the opacity at each radius.Add to this that if a medium is static a photon leaves a line, or is absorbed, at a wave-
length that’s symmetric around the line center and not shifted by the differential (Doppler
effect) motion between strata.Not so in a wind. A photon emitted at the center of a line sees ahead of it a reduced
opacity from the same transition because of the differential motion of the medium. On the
other hand, depending on the spectrum, another line may be shifted in the way. This is
the cross-coupling effect we’ve already discussed during the Fe-curtain phase of the nova
outburst. In a wind, except in the most optically thin case, this is inevitable. It is
the real reason for the absorption trough on the P Cyg profiles you’ve seen in windy
stars.But there’s another thing about a wind that highlights the “non-locality”.
A wind is driven so it has to reach a terminal velocity. You don’t have infinite energy
to accelerate the flow forever. This means the rate of change of the velocity decreases
with distance from the star (or the driver, more generally). So in the outer wind, a
photon sees a longer effective absorption path length ahead of it because all of the
material above a certain radius is almost moving at constant velocity.Not important that the density is decreasing, the velocity is constant. So the optical
depth can be large even though the density (locally) is small. This produces the deep
absorption that has a well defined edge in the P Cyg profiles of winds; the velocity
gradient goes to zero at distance and the effective path length approaches infinity.OK, it doesn’t become infinite, but all of the matter is at the same velocity.
Instead, in ejecta, the stuff has been blown off at a moment and the driving is over.
Until there is a deceleration, and for matter far enough above the escape velocity this
can be very far from the star, the expansion preserves the velocity field. Eventually
there will be interaction with a background (if there is one, like the RS Oph-type novae)
or a small nonlinear gradient can appear, but this is late. In general; the matter is
going at its terminal velocity and each piece is independent. The formation of the
spectrum is, therefore, different than a wind — there’s no terminal velocity, just a
maximum — and the line profiles show this. Instead of well defined edges, the lines show
the change in the density along the line of sight, not mediated by a decreasing velocity
gradient. Unlike a wind, because there is no active driving, changes in the opacity just
change the spectrum and the thermal state of the matter but this is completely dependent
on the local densities and the highly non-local radiation field. So there is nothing to
constrain the density to be any particular value locally, and the structures remain and
don’t advect (move outward relative to the ejecta) with time as they do in a wind.The ejecta are also very different than an H II region or even a planetary nebula. The
velocities are high and can be very different from one point to another, and very time
dependent. The recombination timescale in an H II region is long but the ionization
source remains on so the state of ionization of the gas can reach a balance. In a wind or
ejecta, this can be very different. The state of ionization of a gas can remain very high
even when there’s no longer an ionizing source because of the expansion. The decrease in
density slows recombination so even if the central source is extinguished the expansion
can decrease the density fast enough to effectively halt recombination. An H II region
doesn’t expand supersonically even though it DOES expand so the state of the gas is
governed by the collisions (rare though they are) and the ionizing photons (diffuse or
central). The same is true for a supernova but there the mass and energy of the ejecta
are so great that the shock from interacting with even a rarified interstellar medium is
enough to power the ionization and emission until the ejecta fall to the local sound
speed.While this doesn’t have anything in particular to do with what’s happening now — at this
moment — in our favourite nova, I hope it puts the observations in perspective. There’s
another reason for this tirade.Stellar classification is the reflection of the regularity of stellar atmospheres that
comes from this double equilibrium. Becau
se the radiation and matter are coupled in a
static medium, depending on the composition you would expect a particular spectrum to
arise from a run of thermodynamic conditions in the atmosphere. So there is a sort of
link between the features of the spectrum and the luminosity and radius — the latter are
combined in the “effective temperature”. This isn’t true for ejecta of any kind, and even
for winds. The spectrum is not unique for a structure, the worst non-equilibrium
environment you could fear dominates its formation: the matter and radiation are coupled
dynamically and locally and non-locally and may be time dependent. The desire to find a
classification system of any kind for phenomena that have such a wide range of variation
is potentially misleading and certainly much different than the basic taxonomy of stellar
atmospheres. One last example. The ionization of specific elements, line ratios among
ions of the same element, is used as a temperature indicator. In a static medium this
works. In a dynamical medium, as you know, this isn’t true. In novae, for instance what
you will see very soon, the same spectrum can show [Fe X] or He II and O I. They’re
coming, perhaps, from different pieces of the same ejecta with different densities at the
same velocities.Range of interest
Oh, one more thing, not in the previous message: The universality of the optically thin
profiles, the best examples being the O I lines, makes for a useful tool — the peak at
+550 km/s is identical in all the profiles and just this one peak is enough to link to
the rest wavelength. I’ve checked this with about a dozen examples and it works almost
perfectly, meaning that the ionization and density structures are being identically
sampled by all available lines (mainly neutrals).One example: next to Fe II 5018 there’s an emission that *could* be He II 5047. But
using the profile, it is almost certainly C I, like the 7115A line. The one for which it
isn’t working is the line around 6720A. That’s still a sort of mystery and since it’s
even visible at low resolution (< 3000) I recommend keeping track of its development in
the next few weeks. It could be something interesting.Mere Q & A omkring det vi har observeret
Q: I’m rather confused about the CN 4216 line.
A: To confuse you more, The CN didn’t appear. It *may* mean it’s not a unique
feature of the precursor event — it was a hope to test that and the density of observations
did. There is only one clear report in any nova and that is only – I think – because DQ Her
was the brightest dust forming nova to have this early stage densely covered. It may not
be a unique signature, if dust does form here, the observation that CN was NOT detected
becomes the definitive disproof of uniqueness. Firm statements are definitely welcome
and that will be one. If dust doesn’t form, then we’re still stuck not knowing.Q: Another question that puzzles me in my own low-res observations. If I want to
compare the continuum of the nova in visual light 3700 – 7000Å of all my observations, at
what wavelength area should I use normalize? Right now I’m using 6700-6920ÅA: This is a hard question. It would be best to normalize to the photometry. Even
though that’s dangerous you can use a region line that around H-alpha (say V or R) and
use that for scaling. Alternatively, if you can find lines that are not varying, that
helps.A check is the DIBs (diffuse interstellar bands) that you can see in the higher resolution
spectra at 5780-5800A, for instance. These don’t vary. The same for the Na I D lines. The
interstellar value should be constant so a check on any contaminating continuum or
variation is to use that equivalent width. Otherwise it is best to go as far from the
line center as you can, at this stage it’s hard with the complexity of emission and
absorption features.Opdatering til ovenstående spørgsmål:
ARAS gruppen (Buil og Leadbeater) er vist kommet frem med to metoder til at beregne
fotometri ud fra spektre og derved få absolutte tal. Derved kan amatør optagelser
sammenlignes med en uhørt præcision og give yderlig videnskabelig værdi til observationerne.
Et meget stort skridt fremad.
http://www.astrosurf.com/buil/calibration2/absolute_calibration_en.htmAnimation der fint viser ændringer i jern linjerne (Iron curtain)
Olivier Garde har lavet denne fremragende animation med alle hans data siden d. 14. aug.
(31 spektre). Vi ser Fe II linjerne ved 5169, 5198 og 5235 Å.
 12. september 2013 kl. 22:38 #106870
nightskyDeltager- Neutron star
Artikel 10 fra Steve Shore
Iron and Iron lines in nova
Remember the original solar mixture, from the ’20s, was mainly heavy elements because
the Balmer lines are so weak. Payne (later Payne-Gaposchkin, yes, her!) demonstrated
that requiring ionization equilibrium as a function of density and temperature together
with hydrostatic and thermal balance produces a spectrum that changes appearance even
with constant abundance. Novae are strange because they pass through so many regimes of
temperature and density that, unlike a star, vary on short timescale (hence nova ejecta
NEVER resemble a stellar atmosphere and rarely a wind). The Fe isn’t a product of any
nucleosynthesis during the nova, any more than it is in a red giant compared to a main
sequence hot star. It’s an effect of the ionization and line formation. The lines are
relatively more intense because they arise from a dominant ion. For instance, was the
temperature as high as during the fireball, you’d see only He I and Balmer lines, it’s
the same ejecta you were observing a month ago but the temperature and density conditions
are very different now.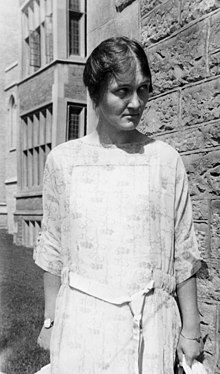
Cecilia Payne-GaposchkinFor the temperatures reached in the thermonuclear runaway, less than 0.3-0.5 GK (a few
100 keV), you don’t obtain free neutrons (for the heaviest elements, as in r-process),
you don’t have enough time for s-process, and the explosion isn’t the result of gravitational
collapse so the energies available are far lower and you have reactions of charged particles
that run similarly to a stellar interior. To get to iron and the heaviest elements
requires continued special conditions that break out of the A < 40 region (e.g. calcium),
and that doesn’t occur.This term “Fe II” nova is, again, just a way of saying “still optically thick and cool”.
The temperature of the ejecta drops from expansion, recombination leads to a more neutral
medium, and the radiation field is shifted to the UV and absorbed there to be re-emitted
in the visible. At the same time the excitation by collisions becomes less efficient for
the higher states, it’s linked to the kinetic (actual thermal motion) temperature of the
ambient electrons, and the lower temperature also means recombination’s are more effective
in reducing the ionization. So the combination leaves the metal lines, which are present
in two ionization stages (at least) and come from about a dozen possible species with
literally millions of possible exciting coupled transitions, dominate the spectrum. The
same sort of state change happens in a supernova expansion but at a different rate and is
more complicated because of the radioactive material from the nucleosynthesis and the
stronger shock (not to mention more matter).The abundances of the heaviest elements, e.g. Fe and higher, are so high because of
internal nucleosynthesis in the fireball of the expanding envelope of the collapsed star.Again, it’s important to emphasize that the processes we see for line formation in a nova
are like those in a star but in a dynamic medium so the complications result from the
interplay of velocity differences and total abundances. The heavy elements, even at 10^-5
the abundance of H and He, are still the main contributors to the opacity in any cosmic
plasma with solar abundances or the like in the temperature range below about 100 kK.Low resolution
And for the low resolution, I would always say yes as a check on the overall behaviour of
the continuum and also for the checks against photometry…Low resolution work is more important if it can be calibrated, the high resolution
spectra are also not going to be feasible for as long as low so the cross calibration is
very important while both can be obtained.Nogle links:
s-process

The s-process or slow-neutron-capture-process is a nucleosynthesis process that occurs at
relatively low neutron density and intermediate temperature conditions in stars.
http://en.wikipedia.org/wiki/S-processr-process
The r-process is a nucleosynthesis process, that occurs in core-collapse supernovae, and
is responsible for the creation of approximately half of the neutron-rich atomic nuclei
heavier than iron..
http://en.wikipedia.org/wiki/R-processNightsky 2013-09-21 23:14:27 19. september 2013 kl. 19:02 #107299
nightskyDeltager- Neutron star
Artikel 11 fra Steve Shore.
The “Helium Flash”
Spændende læsning der fortæller en del om hvad vi ser i spektret.
The last spectra from Sep. 18, now show He I 4923, 5876, 6678 (weak, on the Halpha wing)
and 7065, so the ionization is progressing in the ejecta. The [N II]5755 line seems to
have been present as early as Sep. 8 but it’s now not only quite strong, but also shows
the same profile as the other optically thin lines. The He I, in contrast, shows a strong
emission but also possibly (at low resolution) an absorption at moderate velocity. The N III
complex around 4640 has remained essentially unchanged; an indication that the UV is
still marginally thick, but if it’s not too much of a stretch it looks like He II 4686
may be present.
Her har jeg hentet en optagelses ned fra d. 18. sep. lavet af J. Edlin.
En fantastisk database med flere hundrede optagelser er tilgængelig her
http://www.astrosurf.com/aras/Aras_DataBase/Novae/Nova-Del-2013.htm
lige til at åbne i Visual Spec og lave sine egne analyser. Det bliver ikke bedre.If you look now at the spectra you’ll see one of the effects I was discussing earlier,
something that shows up contrasting the Balmer and He I lines. The [N II] and [O I]
aren’t only forbidden, they’re also ground state transitions. The others are from excited
states which means their populations are determined by recombination and photons in the
UV that populate these levels. For example, something I should have mentioned earlier,
the Lyman series is responsible for the occupation of the Balmer line levels, Ly alpha
couples to the n=2 state of hydrogen, but Ly beta, because its upper state is n=3 — if
optically thick –, powers some (or most) of the emission on H alpha (n=3 -> n=2).Now, again, think like a photon. If the ejecta are not spherical, these photons can leak
out both through the main Balmer lines and also from the sort of surface that isn’t a
sphere. You see that in the highest velocity parts of the Balmer line profiles that are
stronger than anything (by contrast) on the other lines that are intrinsically weaker
(and also from much less abundant species). So the peaks have the same velocities but the
relative contrast in densities between different parts of the ejecta you see more clearly
in the Balmer lines than the others. The He I (and eventually He II) form in the inner
ejecta so they have less visible “horns” since the line is weak from the outer ejecta.These last spectra, at R ~ 1000, show the value of continuing the lower resolution work.
Don’t get frustrated that the details may not be as evident. If youhave a resolution of
~100 km/s that’s a good coverage of lines that spread over a few thousand km/s, remember
that much of the UV work was based on IUE spectra with the same (or lower) resolution!
For example, it looks now like the absorption on H delta is displaced from the line at
about -2000 km/s, as it has been in other novae at this stage. But this is so far the
only line that seems to show this (it can’t be a blend with4076 since that’s a
doublet and has a high ionization energy, it’s something seen in shocks of high velocity
around protostellar jets, for instance, and in supernova remnants along with6713,
6730) but here the absorption seems real.A few other diagnostics are important, in part because they’re not yet seen. Neither [Fe VII]
6086 nor [Fe X] 6376 are present, so if there is any XR emissionn irradiating the ejecta
it is still being absorbed by so much cooler mater in the inner part that it can’t yet
ionize the regions of lower density in the periphery. The [NO III] 4363, 4959, 5007 lines
are not there yet, again a strong pointer to the still high opacity in the middle and far UV.
Yet the O I 8446 remains strong, so there is a very strong pumping still by Ly alpha of
the O I 1302 resonance line.I hope the emphasis on small things won’t mean you’re staring to lose the big picture.
The reason for all these details is to give you an idea of how to diagnose this
particularly ill patient. Like a prescription in Hippocrates or Galen, you look at all
the symptoms before making a diagnosis. Look at which lines are visible noting the
ionization state. At this stage it will be more important than which lines in a specific
ion are there. Look at how the line profiles change with that ionization energy, this is
the tomography of the body.steve
PS:
Der arbejdes lige nu med HST/STIS optagelserne af Nova Del 2013. Det bliver spændende om
der kommer nyt i aften eller i morgen. De bliver postet straks jeg modtager dem.Nightsky 2013-09-21 23:13:35 20. september 2013 kl. 15:40 #107340
Frank LarsenModerator- Super Nova
Spændende. Må snart ud og lave nye spektra – ser ud til at der kommer en åbning i næste uge – bare noget p.. at jeg skal til udlandet et par dage.
20. september 2013 kl. 19:34 #107345
nightskyDeltager- Neutron star
Hej Frank
Jeg venter selv på et hul mellem skyerne. Vil også prøve at få et spektre af Jacobs stjerne.
Endnu et spændende telegram om Nova Del 2013
Ongoing near-infrared observations of V339 Del (Nova Del 2013)
ATel #5404; D. P. K. Banerjee , N. M. Ashok & Vishal Joshi (1) and Nye Evans (2); (1) –
Physical Research Laboratory, Ahmedabad, India ; (2) Astrophysics Group, Keele University, U. K.
on 20 Sep 2013; 17:22 UTCredential Certification: Dipankar P.K. Banerjee (orion@prl.res.in)
Subjects: Infra-Red, Cataclysmic Variable, Nova
We report continuing 1.08 to 2.35 micron near-infrared spectroscopy of Nova Del 2013 in the
J,H,K bands with the Mount Abu 1.2 meter telescope (+ PRL Near-Infrared NICMOS3 imager/
Spectrograph). Subsequent to our initial report on August 28.674 UT (ATel #5337), spectra of
the nova have been obtained at regular intervals. The latest spectra of September 16.5 and
19.5 UT are dominated by strong emission lines but the earlier reported strengths of many of
the lines have changed significantly. In the Sept 19.5 spectra, the most striking development
is the fairly rapid increase in the intensity of the He I lines at 2.0581 and 1.0830 micron, a
clear indication that the radiation field is hardening. Hydrogen lines still remain strong viz
H I Paschen-beta and Paschen-gamma, Brackett-gamma and Brackett 10 to 20 in the H band.
However the O I line at 1.1287 micron is by far the strongest line indicating a considerable
contribution from Lyman beta fluorescence. This line has an EW of -378 nm compared to an EW of
-135 nm of the strongest HI line seen viz. Paschen beta. The ratio of OI 1.1287 to OI 1.3164
is approximately 75. The carbon lines reported earlier (ATel #5336, #5337) are still present
but have weakened considerably in a manner consistent with their expected temporal evolution
in the Fe II class of novae (Banerjee & Ashok; BASI, 2012, 40, 243). For e.g. the intensity of
of the CI 1.175 micron line was almost equal to that of Pa beta on 28/29 August; at present it
is ~ 0.17 times the Pa beta line strength.No molecular first overtone CO emission has been seen in the K band during the entire duration
of our observations. The unidentified 2.0890 micron feature in the K band has also been
present for some time. At the moderate R = 1000 resolution of the spectra, hints of a triple
peaked structure (central peak strongest) are being consistently seen in the HI line profiles,
especially for Br gamma at 2.1656 micron, possibly suggesting a bipolarity in the flow. The
nova has remained bright in the near-IR; we measure J = 5.64, H = 5.71, K = 5.54 on September
10.6 UT (also see ATels #5294, #5317 and #5340 for earlier IR photometric results).Nightsky 2013-09-20 19:37:51 22. september 2013 kl. 00:09 #107372
nightskyDeltager- Neutron star
Q & A
Q:
I artikel 10 om jern og jern linjer i en nova, står der at:
The abundances of the heaviest elements, e.g. Fe and higher, are so high because of internal
nucleosynthesis in the fireball of the expanding envelope of the collapsed star.Det gav anledning til et spørgsmål hvad denne interne kernesyntese er og hvor den opstår.
Normalt tænker man jo på supernovaer, når der tales om dannelse af tunge grundstoffer.A:
In answer to your question, it’s related to the nucleosynthesis in a supernova relative
to that in other types of explosions, so just a word on the background.Following the collapse of a type II (core collapse) supernova and the formation event for
the neutron star, a combination of neutrino emission from the core and the bounce of the
stellar envelope on the newly formed neutron star drive a shock outward. This accelerates
moving toward lower density and the matter is ejected — it reaches the escape velocity
from the neutron star everywhere. This is essentially different than a nova explosion,
the shock here is propagating outward through infalling matter and is powering the
ejection and setting the outward velocity. The temperature is enormous behind the shock
(after it passes), high enough to produce rapid neutron capture and nucleosynthesis.
This, both neutron and proton capture, produce heavy elements of which Fe and related
elements are important products. The rapid capture of neutrons (because the background
number density is very high and the temperatures are as well, hence fast reactions)
builds up neutron rich heavy isotopes (for instance, of the rare earths like Eu).. In a
type Ia, which is not core collapse, the shock produces Fe and Co and Ni as its main
nucleosynthesis. The ejecta are hydrogen poor, unlike Type II, and the reactions are
mainly through alpha and heavier ion captures. The r-process is not as important as for
Type II, and the Ia’s are responsible for much of the Fe in the Galaxy.The terribly hard problem that’s remained open for decades is: what’s the progenitor of
the Type Ia’s. This is the link to novae for a large part of the community. Where there’s
a white dwarf accreting, if it continues to accumulate mass (the net mass increases even
after explosions), then it may reach the Chandrasekhar mass that is the stability limit
for a degenerate star supported by electrons, and the subsequent collapse forms a neutron
star and ejects the remaining white dwarf envelope with the associated nuclear
processing. This is the physics (or scenario) behind the apparent uniqueness of Ia’s,
that they have about the same absolute brightness. If they all collapse at the same mass
“it’s obvious” they’ll release the same amount of energy. But it’s certainly not clear
that they’ll be as close to standard candles as the Ia’s seem to be.Q:
Ovenstående svar gav så et nyt spørgsmål omkring dette “shock” skal forståes. Er det en
front som ved en eksplosion som blæser alt omkuld eller skal det opfattes som en storm,
noget der har en udstrækning, eller noget helt andet?A:
More like a permeable (gennemtrængelig) wall, or a piston; the point of a shock is a
pressure front that moves faster than the sound speed. The matter ahead of the shock
isn’t slowed by pressure waves, it’s swept up in the front as it passes, what happens
when a high velocity car or train passes to the leaves or papers on the ground is a good
analogy. After the train passes, the papers and leaves follow at some slower speed as if
swept up, (which, for a number of reasons, they in fact are).Q:
Den hvide dværg er sandsynligvis af CO typen. Hvis man søger på nettet for at finde ud af
hvilken type moderstjerne den hvide dværg stammer fra bliver det ikke helt nemt. Der tales
om solmasser under 4 og andre om solmasser under 9 for CO typen.A:
Whatever the progenitor mass, it’s only coming out of scenarios.Since we know that CO and ONe novae can also be recurrents in symbiotic stars, I think it
makes relatively little difference now.Other than saying that the formation of the ONe core requires a higher mass star, with
all the attendant physical differences that may happen in the advanced stages, there is
little that I think can be said with the precision you’re asking. This is a question
mainly for the SN Ia controversy but we don’t know if we need a WD of one or the other
composition since that’s hidden by the nucleosynthesis in the explosion (it sort of wipes
out the memory of the original composition).
Forsat god aften – i morgen tidlig er der finaler ved Cold Hawaii.
http://new.livestream.com/friendsofcoldhawaii/KIA-Cold-Hawaii-PWA-World-Cup-2013Nightsky 2013-09-22 08:37:15 24. september 2013 kl. 19:05 #107474
nightskyDeltager- Neutron star
Så kom der endnu et Astronomers Telegram omkring Nova Del 2013 og de data som Hubble tog i
onsdags med STIS spektrografen.Bemærkl at amatørgruppen fra ARAS er med hele vejen. En kæmpe indsats med spektrografi
fra dem. Som tidligere nævnt er dette den bedste og mest observerede Nova til dato, takket
være det store amatør netværk.
ARAS database for Nova Del 2013
http://www.astrosurf.com/aras/Aras_DataBase/Novae/Nova-Del-2013.htmNightsky 2013-09-24 19:06:30 25. september 2013 kl. 18:23 #107514
nightskyDeltager- Neutron star
Artikel 12 – Indication of dust formation?
V338 Del (Nova Del 2013) Mulig støvdannelse.
– Lavopløsningsspektra kan hjælpe med påvisning af støv.
– Måske vil vi se at molekylær dannelse ikke er et forstadie til støv kondensering.There is an indication based on the infrared and slight changes in the optical photometry
that V338 Del may be entering a dust formation episode. If this is really happening there
are several important things to note for observations in this next week. Note that this
will be the first time since DQ Her (nova), if really starting, that this stage
will have been seen and it was impossible to follow that nova (in 1934) during the
minimum. You all have the low resolution capability to keep going — if you want to —
even through much of what could be a deep minimum (a drop of 5 or more magnitudes is not
impossible). For high resolution observations, a question is where and how the dust forms.We know something of this from the very old observation of V705 Cas 1993 that was
observed in the UV during the start of the episode (http://adsabs.harvard.edu/abs/1994Natur.369..539S),
but that was a chance observation not covered in the optical. First, assuming the ejecta
are bipolar and inclined, the line profiles may change in a peculiar way: as the dust
formation proceeds the portion of the ejecta (the outer part) should become opaque (depending
on the geometry) and the blue part of the line will disappear. On the other hand, the
whole profile will drop, especially for the N II line and He I lines, if the ejecta are
more spherical because both parts of the line forming region will be absorbed. The UV has
now been measured, we know how much energy is available for absorption by the grains and
that emission in the infrared can be compared with that lost in the visible. If the two
balance out (everything absorbed is re-emitted) we’ll know that the ejecta are spherical
(every photon is intercepted in a spherical, completely opaque shell). On the other hand,
if there is an imbalance, that will be due to the filling factor and geometry of the ejecta.
So if this really is the start of the event, the ejecta will act as a sort of calorimeter,
registering how the energy balance proceeds.The changes in different lines (e.g. [O I] vs. He I) indicate where in the ejecta the
dust is forming, although at this stage I have to say we don’t know much — only V705 Cas
has been observed during such an event and in the UV at low resolution. When it happened
there, the whole UV disappeared without the spectrum changing, as if a new “curtain”
dropped uniformly over the line forming region. This time, it’s anyone’s guess and your
work will be vital.One more thing: none of the spectra showed ANY indication of molecular emission (CO, in
the IR) or CN (in the optical, your hard work). If this nova forms dust, we will have
learned something tremendous, that molecular formation is not a precursor event to dust
condensation. If so, it is in line with the idea that reactions between neutral atoms and
ions of carbon and silicon cause a sort of kinetic runaway in which the grains aggregate
like fluffballs. No matter what now happens, without your spectra we would not know that
this nova did not form the molecular seeds and that if this does condense it likely is
particle-based process instead of a thermodynamic-like phase transition (the difference
between agglomeration (kinetic) and homogeneous nucleation (like terrestrial clouds and
rain, around nuclei in a saturated vapor). With apologies for referring to my own stuff,
but this paper is an example of what I’m talking about:http://adsabs.harvard.edu/abs/2004A%26A…417..695S ; see also
http://adsabs.harvard.edu/abs/2012BASI…40..213E
http://adsabs.harvard.edu/abs/2007M%26PS…42.1135JOnly time will now tell, but I hope you’re getting some idea from this how important your
observations have been and are.The important thing to note is that such events have been observed in supernova ejecta in
early stages but, again, that is complicated by the very complicated ejecta structure.
Here it is simpler and since we have the optical and UV just before this event the
luminosity of the white dwarf and the continuum of the ejecta is known.Steve
——-
V705 Cas 1993 lyskurven.
DQ Her 1934 lyskurven.Jeg vender forhåbentlig meget hurtig tilbage med mere specifikke oplysninger om hvad vi
skal kigge efter.29. september 2013 kl. 19:36 #107796
nightskyDeltager- Neutron star
Artikel 13
This is a lovely start to the ionized stage.
V339 Del -> Nova Del 2013The Swift team has just announced the detection of X-ray emission from V339 Del (ATel #5429).
They give a flux that is a very small fraction of the STIS detection: in the range from
1-10 keV (corresponding to a temperature of about 10 MK), 2.3e-13 erg/s/cm^2 while the
UV(1200-3000A) gives 1.7e-8 erg/s/cm^2. This large ratio is at the start of the event but
has already been corrected for hydrogen absorption.Interestingly, the Lyman alpha line in the UV observations seems weaker than would be
expected from the XR data, a suggestion that the ejecta are also not completely covering
the central start but are covering the region of XR emission. The nova remains very bright
in the visible and this is a real problem for the XRT on Swift that suffers from optical
leaks (it’s the nature of the detector). Your spectra are indicating the start of [O III]
4959, 5007 emission and also that He II 4686 is there. Now the He II 5411 line should
also appear (a check on the He II identification) and the disappearance of the Fe II and
other curtain lines will be a very important (and pretty) thing to watch over the next one
to two weeks.To put this part in physical context, what’s happening is an advance, from the inside
out, of the ionization front as the WD emission strengthens. It’s always the same basic
picture, but the phenomenology accelerates now. The ionization of the heavy metal lines
removes the opacity faster than the change in density so the optical decline should also
steepen (which may be mistaken for a dust-forming event), and the highest ionization lines
from permitted transitions will have narrower profiles and come from the inner ejecta.
The outer part, and here the ionization state is a very good measure of the filling
factor (how fragmented the ejecta are governs how much of the ionizing radiation
penetrates to the outer part at this marginally thick stage); their profiles at high
resolution will be the best comparison with the [O I] and [N II] as a map of the ejecta
structure. Remember, He II is from excited states but are all permitted transitions while
the [O III] and others are low density transitions (forbidden).To give some idea of what things look like in the UV I’m including the OS And – V339 Del
comparison. The very narrow lines that go to zero in the V339 spectrum are all interstellar
transitions (keep in mind that the resolution is about 100,000). For OS And, it is about
10000 (high resolution IUE from Dec. 1986). No extinction correction has been applied
(no interstellar dust effects have been removed) for the comparison) so you can see the
lines (e.g. He II 1640 + curtain, N III 1750, Mg II 2800, etc). The 1200A region is
particularly important for the properties of the ISM and the ejecta — this is where the
Ly-alpha profile sits (you see there seems to be emission there, and in fact there is a P
Cyg profile under the curtain on the line).
Sammenligning med Hubble data fra sidste uge.More will be coming in the next few days, thank you all for the continuing hard work.
The changes will now be quite remarkable as the nebular spectrum appears and the
continuum disappears (this was already noted for T Aur by Clerke in her description of
the transition, and also Huggins).
http://www.nasa.gov/mission_pages/swift/spacecraft/index.htmlhttp://arxiv.org/pdf/1211.3176.pdf
Spectroscopy of Novae – A User’s Manual by Steven N. ShoreNightsky 2013-10-02 19:53:12 29. september 2013 kl. 19:45 #107799
nightskyDeltager- Neutron star
Hejsa
Var ude i aftes for at kigge på V339 Del (Nova Del 2013)
Umiddelbart ser det ud som om at emissionen er blevet kraftigere, men hvis man undersøger det
nærmere vil man opdage at det er kontinuum der bliver svagere for til sidst næsten at forsvinde,
ganske som Steve Shore beskriver sidst i artikel 13. Novaen begynder at ligne en
planetarisk nebula i sit spektrum.Nedenfor 2 optagelser fra i nat. En i det visuelle domæne, gældende op til 8000Å og en
med IR longpass ~6850 Å filter, således at 2 ordre ikke kontaminer oppe i IR området.

Sidste gang jeg havde klart vejr, 10 sep. fik jeg også et spektrum af V339 Del og jeg har
lavet en sammenligning mellem de to.
Markeringer hvor jeg umiddelbart ser signifikante ændringer.
PS. Jeg kan se på http://www.aavso.org/ at der en del problemer med at få nøjagtige magnituder
ned via fotometri.
http://www.aavso.org/nova-del-2013-photometry
Måske noget at filterne ikke er helt som forventet.Nightsky 2013-09-29 19:57:20 30. september 2013 kl. 00:27 #107828
nightskyDeltager- Neutron star
29. sep
Spektre fra i aften. Ikke nogen nye emissionslinjer jeg kan detektere.

Sandsynligvis er kontinuum ændret, men jeg må vente på darks for at finde ud af dette.
30. september 2013 kl. 23:43 #107929
nightskyDeltager- Neutron star
Hejsa
En helt fantastisk animation lavet af Martin Dubs, viser hvorledes novaen har udviklet sig
når der flux kalibreret.Som det ses ændrer styrken af brint emissionen sig ikke ret meget. Derimod er det kontinuum
der falder kraftigt. Et fantastisk smukt eksempel der viser hvorledes emissionen forsætter, mens
novaen falder i lysstyrke.
Animation der er flux kalibreret, Created by Martin Dubs.
Spectra recorded by Olivier Thizy, Jim Edlin and Francois Teyssier
Data obtained from the ARAS data base: http://www.astrosurf.com/aras/Aras_DataBase/Novae/Nova-Del-2013.htm -
ForfatterIndlæg
- Emnet 'V339 Del, NYT 29/10 – billeder af novaens ildkugle' er lukket for nye svar.