› Fora › Søg i forum ... › Søgeresultater for 'V339'
-
ForfatterSøgeresultater
-
25. august 2013 kl. 19:33 #106123
Som svar til: V339 Del, NYT 29/10 – billeder af novaens ildkugle
nightsky
Deltager- Neutron star
Ulrik, jeg vil lige gøre opmærksom på at jeg ikke bidrager med data som bruges efterfølgende.
Jeg kan højest gøre opmærksom på en ændring, som andre amatører med deres mere
avancerede instrumenter så kan måle på.PT. har jeg kun min Star Analyser kørende, som kan indikationer omkring ændringer i flux på
Balmer seriens emission (mine observationer er lige bekræftet) og ændringer i kontinuum.Forhåbentlig kommer der bedre spektrografer i gang snarest.
25. august 2013 kl. 10:06 #106107Som svar til: V339 Del, NYT 29/10 – billeder af novaens ildkugle
ulrik
- Planet
Tak for oplysningen Lars !
Svært stof men spændende at følge med i. Og ikke mindst hvad flere af jer avanceret amatører kan bidrage med. Godt gået !
Ulrik
25. august 2013 kl. 02:45 #106101Som svar til: V339 Del, NYT 29/10 – billeder af novaens ildkugle
Deltager- Neutron star
Artikel 4 fra Steven Shore
—————————–To this point I’ve concentrated on the optically thick stage because, well, that’s where
we are. But Francois suggested discussing the forbidden lines so first a bit of atomic
physics in a cosmic context.Let’s concentrate on atomic lines since the molecular species (in novae) are few. The
environment is usually too hot (both in a kinetic sense and that the radiation is too
hard) for their formation and survival. Uniquely, during the opaque stage when the gas
temperature can fall below 5000 K, some radicals I’ve mentioned (e.g. CO, CN) can both
form and remain stable. But in general, most emission lines from stellar sources are
atomic. As a general statement, light is emitted when an electron (or more than one if
they’re strongly coupled) transitions from one state to another. A state is a specific
energy level that has an associated spin and orbital angular momentum — or rather a
specific symmetry. You know these from orbitals in chemistry.If the electron distribution changes, it does so by emitting (or absorbing) a photon of
the same energy as the *difference* in the energies (to be precise, divided by Planck’s
constant). Only the ground state, the most tightly bound energy that is usually taken as
the zero point of reference, is stationary. Any excited energy level ultimately decays —
a transition to a lower state occurs in a finite time. The symmetries are the collective
result of all the electrons in the atom (or ion), they interact electrostatically because
they are charged and at different distances from the nucleus (hence from each other),
they have spins that induce a magnetic moment (they behave like dipoles and combine
according to their relative orientations (in the nuclear electrostatic field, spins are
“up” or “down”) and they also combine depending on their orbital angular momentum (for
this read the angular pattern of the collective electron “cloud”). Different approximations
have been developed to describe these couplings, nd this is the classification of each
energy level you’ll find in, say, the NIST tableshttp://physics.nist.gov/PhysRefData/ASD/lines_form.html
Within a coupling scheme, not all levels can directly couple to others; certain so-called
transition rules are obeyed. For example, for hydrogen, the angular momentum must change
by one unit in any jump between levels, so there are states that cannot be connected by
what are called permitted (electron dipole) jumps. If this sounds technical, perhaps it’s
easier to think of the analogy with an antenna.A dipole has a particular radiation pattern. The same for a so-called permitted
transition. These are the most probably jumps between tw levels, and have the highest
rate (highest transition probability); for hydrogen, the rat is about 10^8 – 10^9 per
second (implying that an excited state statistically lasts for a few nanoseconds before
decaying). These will have different intrinsic strengths depending on how the electric
dipole changes in the transition.Any environmental disturbance, say a collision with a background charged particle, is an
impulsively varying electric field hat induces a transition without emitting a photon.
Since these occur randomly, the lifetime has a distribution and is reduced relative to
its purely radioactive decay. Thus, and the collision can also excite the electron if the
perturbing particle has sufficient energy, the excitation and de-excitation couple the
internal energy states to the background.This is what thermal equilibrium means on the microscopic level, the populations (the
probability of the electrons being in any state) depends only on the local temperature
that determines the energy distribution of the background charged particles (and neutrals,
for that matter). For example, an absorption can occur but if before the state decays its
hit by a perturber, it de-excited without further emission and the gas is heated, this is
the absorption process and happens when the gas is dense. The photons are therefore
trapped within the medium; in a stellar or planetary atmosphere this means the spectrum
will show absorption that depends on the number of atoms along a line of sight. In a low
density gas, re-emission can occur because the level can decay freely but because the
emission pattern is not only along the line of sight there are fewer photons arrive in
your direction so the “missing” light will appear as an absorption feature.The difference is that this scattering process doesn’t heat the gas and the process
conserves the number of photons so is coherent (hence polarized). The best example of
this is the blue of the daytime sky (although that is a molecular scattering process the
process is analogous). Both absorption and scattering occur during the first optically
thick stage of the expansion of the nova ejecta.But there are less probable transitions, those that according to coupling rules cannot
happen by emission/absorption in a dipole mode.These are the so-called forbidden lines because they can’t be connected by an electric
dipole transition. These normally “thermalize”, their lifetimes are so long that
collisions always (except for very low densities) provoke the decay. The rate of
collision (density dependent) compared to the decay rate (intrinsic) governs whether
these lines appear. They don’t in the laboratory except under very extreme conditions
(they have lifetimes as long as seconds or more, in air in your room the collision times
are nanoseconds) but in hot, low density regions (nebulae, or the expanded ejecta of
novae and supernovae) they appear. The O I 6300 line, seen in aurora and the upper
atmosphere of planets, is a good example. It isn’t seen in the lower regions because its
lifetime is about 180 sec.But if the density falls below 10^5 /cm^3, then O I can emit in this line. The same holds
for higher ions and the demonstration that a region has a low density is the presence of
these highly improbable lines in the emission spectrum.Another feature is that there are a lot of these, and from any excited state there will
frequently be other than permitted transitions possible. Once the ejecta density drops
far enough, the presence of the central white dwarf (that provided the radiation
necessary to excite the ions in the first place) guarantees they will be observed.Think of planetary nebular, the part that’s emitting in say [O III] or [N II] is the low
density region exposed to the ultraviolet part of the central star’s spectrum that is
therefore excited by absorption and radiatively de-excited.These lines are ideal diagnostic signatures of the physical conditions in the ejecta. If
you see them at all, the density must be low regardless of the excitation source. The
hotter (harder) the spectrum of the central star, the higher the ionization of the outer
parts of the ejecta and the stronger (relatively) the forbidden lines. This is the stage
that follows the optically thick phase of the expansion. The transitions are transparent
(no photon trapping) so you see every piece of the ejecta that radiates (is illuminated
and has a high enough column density to produce observable emission along your line of
sight). Since each piece of the ejecta has a outward velocity that depends on its
distance, and the differences are large, the different parts contribute to different
wavelength intervals around the line centre and the line profile is the projection of the
outward motion along the line of sight weighted by the amount of gas at that distance
from the central white dwarf.Now we come to the heart of the matter, what you see in the profiles.
Take a sphere whose v
elocity is larger at its periphery than interior but whose density
is lower. The highest velocity material will produce less emission so the wings of the
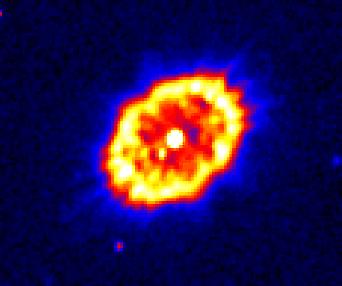
profile will be fainter than the central (slower moving) part. If you have a cone (as in
the resolved HR Del 967 ejecta, the images from HST are impressive, with the emission
strongest on the boundaries, you get a different profile (one with peaks at high velocity
and a deficit in the lower radial velocity). These saddle shaped profiles are seen when
the ejecta turn transparent. Remember, each parcel of gas emits a photon in the rest
frame of the ejecta but you, as an observer, see that Doppler shifted by the projection
of that parcels outward velocity along your line of sight. In the sense, the line profile
in the “nebular” stage is actually a two dimensional projection of the three dimensional
ejecta.Since the forbidden lines are so intrinsically weak, and the densities so low, the
comparison between line profiles of different ions of the same elect “maps” the 3D
structure of the ejecta.As an example, think o two lines, [N II] 5755 A and [Ca V] 5303. The latter is more
ionized (requiring a higher energy) hence traces the “hottest” (most ionized gas. The N
II is, instead, barely ionized. If these two have different profiles it indicates either
different abundance distributions within the ejecta, o different excitation conditions,
or both. Comparing, say, [N II] and [O II] you can get the N/O ratio, the same for any
pair (set) of lines provided the local conditions and ionization energies are about the
same. Otherwise corrections must be applied other measurements: you need a way to
estimate what fraction of an element you don’t see because the higher ions don’t radiate
is the visible. So low resolution is needed to know what ensemble of lines is present,
and high resolution to see the individual profiles and compare them to obtain the
densities, masses of the ejecta, and some idea of what the structure is (knots,
filaments).If you’ve survived to this state (I hope with some pleasure) you’ll see that the nebular
spectrum (the pure emission lines with both permitted and forbidden contributors) is the
only stage at which abundances can be determined unambiguously since it’s only in this
stage that you see all of the gas. For Nova Dl 2013, this will likely occur in about a
month, or at least start, for the CNO ions; for F and related metals it happens earlier
because of the absorption and excitation in the UV.The state of the gas is given by which ions are present, and the ratios of the lines
gives densities and temperatures. That’s again because the states decay with different
rates depending on their couplings. Absorption in the UV followed by emission in the
visible (fluorescence, the same thing that happens in a kitchen bulb — the UV lines
emitted by atoms inside the tube and excited by an electric current is absorbed by an
opaque paint that re-radiates the energy in the visible). This is the origin of the heavy
metal emission lines even in the so-called iron curtain stage and fireball, the lines are
not ever self-absorbing (photon trapping). A density and temperature diagnostic comes
from the O III lines [O III]4636/([O III] 4959 + [O III] 5007), top line has a transition
rate of about 2/sec while the bottom pair have 0.02/s. As the density increases the pair
decrease relative to the 4363 whose decay goes to the upper state of the 4959,5007 pair.So if this makes sense, which I hope, the next step is understanding why the ionization
varies in the ejecta but that’s comparatively easy.Every ionization produces a charged pair. The higher the density the faster the matter
recombines. The lower the UV the faster recombination (lower ionization/removal
rate)hence, while the source is active the high ions are more in the inner part of the
ejecta but that zone expands as the density drops. If he central WD turns off, then the
peripheral layers recombine more slowly than the inner portions and remain more ionized.
In the ISM, after a supernova, this is a fossil H II region. In novae, it’s the state
once the X-ray source extinguishes.—-
steve25. august 2013 kl. 02:16 #106099Som svar til: V339 Del, NYT 29/10 – billeder af novaens ildkugle
Deltager- Neutron star
Frank, absorption, har fået svar. Desuden også svar på hvorfor dette støv måske er så vigtigt. Det er store spørgsmål som forsøges besvaret. Måske en mere fyldestgørende gennemgang ved næste sektionsmøde? Det er ekstremt spændende og rækker langt ud over selve novaen.
Ulrik. Den er klassificeret som en nova så vidt jeg ved. Her er lidt om hvad den var før udbruddet:
Nova is identical to the blue star USNO-B1.0 1107-0509795
(R.A.=20h23m30s.713, Decl.=+20o46’03”.97, B1=17.20, R1=17.45, B2=17.39,
R2=17.74) and ultraviolet source GALEX J202330.7+204603
(NUV=17.88+/-0.04)Nightsky 2013-08-25 02:18:45 24. august 2013 kl. 09:04 #106079Som svar til: V339 Del, NYT 29/10 – billeder af novaens ildkugle
- Planet
Når man er på denne her tråd føler jeg virkelig hvor lidt jeg ved om astronomi.Stjernernes opbygning og “nedbrydning” m.m. Nå men det lykkedes at opspore Nova Del i torsdags med prismekikkert uden de store problemer.Den første nova jeg har set. Spændende !. Igår aftes fik jeg sat min “store” 135mm newton op + at jeg havde fået gravet mit Rainbow Optics gratingfilter op af skuffen.Ville det lykkedes at se lyse linjer i spektret af stjernen med denne størrelse kikert visuelt ?.Lagde ud med
en en pupilåbning på 2,8 hvilket bla. anbefales af producent. Ikke noget
stort spekter men jeg syntes at fornemme nogle lyse prikker idet ?.Satte da spektrum-Forhøjerlinsen på.Hedder den vist?. Nu var spektret forvandlet til et farveløst svagt lille 4:3 billed(svarende til øhh Jupiter på ca.100x).Men her var jeg ikke i tvivl.Jeg så i hvert fald en “klar” emissionlinje og måske flere ved indirekte syn.Super observation for mig.Godt jeg ventede en time ved kikkerten indtil det blev klart.For mig en super observation.
Lige et spørgsmål. Der er jo skrevet meget om nova del 2013. Er/eller hvornår bliver den klassifiseret som nova ? eller er det en vild kataklysme ? Hvad var den opr.magnityde ? Er lige lidt forvirret !
Hilsen
Ulrik
23. august 2013 kl. 16:49 #106057Som svar til: V339 Del, NYT 29/10 – billeder af novaens ildkugle
Deltager- Neutron star
Første publikation omkring det store amatørarbejde på Nova Del 2013.
Continuing spectroscopic observations (3500-8800A)
of Nova Del 2013 with the
Ondrejov Observatory and the ARAS group
ATel #5312; S. N. Shore (Univ. of Pisa, INFN-Pisa); P. Skoda, D. Korcakova, P. Koubsky
R. K?Ã?ek, P. Rutsch, M. Slechta ((Astronomical Institute, Academy of Sciences of the Czech
Republic- Ondrejov, Czech Republic); O. Garde, O. Thizy , T. de France, D. Antao, J. Edlin,
K. Graham, J. Guarro, F. Teyssier, P. Berard, i T. Bohlsen, E. Pollmann, T. Lemoult, A. Favaro,
J.-N. Terry, E. Barbotin, F. Boubault, J. P. Masviel, R. Leadbeater, C. Buil, B. Mauclaire
(contributing participants, ARAS)
on 23 Aug 2013; 01:15 UT
Distributed as an Instant Email Notice Novae
Credential Certification: S. N. Shore (shoreØdf.unipi.it)Subjects: Optical, Cataclysmic Variable, Nova
Observations with the Ondrejov Observatory 2m Zeiss coude spectrograph (R = 18000) are
continuing covering the range 3550 – 8870 A (see ATel #5282). High cadence spectroscopic
monitoring by the Astronomical Ring for Access to Spectroscopy (ARAS) began on 2013 Apr.
14.8 and has continued uninterrupted covering the wavelength interval at resolutions
ranging from 3684 – 7431 A with resolutions ranging from 580 – 11000 with time sequences
as short as 10 minutes at resolutions up to 12000.The ARAS spectra(at this writing more than 230) are publicly available at the consortium
website: http://www.astrosurf.com/aras/Aras_DataBase/Novae/Nova-Del-2013.htmParticipating observers are throughout Europe, North America, and Australia. The coverage
is especially dense during the period spanned by the Fermi/LAt detection and continuing
observations. The rapid changes reported by the Liverpool group (ATel#5300) have not only
been confirmed but resolved although the shortest interval in which significant line
profile changes were detected (R > 700) was > 6 hrs with the variations being far less
prominent on Aug. 20. In addition to reports in Atel #5304, ATel #5305, Balmer absorption
components were detected to at least H14 on Aug. 22 (HJD 2456522.6) with vrad (abs. min)
= -600+/-50 km/s. As reported, the absorption on the lower Balmer lines is also at this
low velocity but the emission wings extend now to approximately +/-2000 km/s, consistent
with the maximum velocity reported in the first observations from Aug. 14. The Na I D
line now shows a complex absorption trough, possibly with components of both the D1 and
D2 lines at -850 and -600 km/s. On Aug. 22.8 the Fe II 4921,5018 A showed absorption
extending to -1400 km/s with weak indications of incipient narrow absorption at lower
velocities. In the 8400-800 A region, O I 8446 may show absorption but has a profile
compatible with the Na I emission and no discernible mean redshift. The changes are now
relatively slower than during the first week and the nova is likely deep into the
Fe-curtain phase in the UV having now passed out of the fireball. The line profiles
suggest possible asphericity of the ejecta but it would be premature to speculate
further. Multiwavelength spectroscopy, especially in the infrared between 2.1 =- 2.3
microns (for Na I 2.20 micron, CO 2.15 microns, etc) are extremely important now; the
only feature clearly present at CN 3883, 4216 are atomic lines (e.g. Ca I 4226) but this
is the period during which any molecular formation would be observed; regardless of the
rate of optical decline this stage is critical to cover with R > 500 and over broad
spectral range.ARAS database for Nova Del 2013
http://www.astrosurf.com/aras/Aras_DataBase/Novae/Nova-Del-2013.htm*****************
Desuden har der åbenbart været lidt polimik omkring kvaliteten af de spektra amatørerne laver,
så derfor lavede Steve en sammenligning mellem Ondrejov Observatory 2m Zeiss coude spectrograph
optagelser og et amatør spektra tager næsten på samme tid (10 min).Resultatet blev:
And I’ve been able to compare spectra. This is just one order, it’s VERY good agreement
and this time — pure chance — the spectra are literally simultaneous. This should clear
any doubts about the quality of the spectra produced by ARAS.Sådan…..
Opfordring:
PT. er Nova Del 2013 så kraftig, at et hvilket som helst digitalt kamera på et simpelt fotostativ,
kan tage et foto af den, som kan bruges til at lave lidt fotometri. Så hver gang det er klart
vejr, tag nogle få billeder af novaen og lav derefter lidt fotometri ved computeren. Så
kan du selv følge med i udviklingen.
Status 23 aug. 15:30 DK tid
Nightsky 2013-08-23 16:51:12 23. august 2013 kl. 16:49 #106056Som svar til: V339 Del, NYT 29/10 – billeder af novaens ildkugle
Deltager- Neutron star
Godt spørgsmål Frank, jeg fandt ikke noget entydigt på dette, så spørgsmålet er sendt videre.
Jeg en del udenfor min komfortzone da jeg læste denne:
http://arxiv.org/ftp/astro-ph/papers/0312/0312031.pdf23. august 2013 kl. 00:19 #106045Som svar til: V339 Del, NYT 29/10 – billeder af novaens ildkugle
Frank Larsen
Moderator- Super Nova
den CN linie. emision eller ?
22. august 2013 kl. 22:09 #106042Som svar til: V339 Del, NYT 29/10 – billeder af novaens ildkugle
Deltager- Neutron star
Opdateringer 22. august.
Paolo Berardi har lavet en flot animation af ans data fra d. 15 til 21 august. Alle taget med
Grundet dårlig vejr er d. 20 aug. interpoleret data.
Profiler normaliseret ved 6730-6750 Å.
Man ser tydeligt udviklingen, og forklaringen som Steven kommer med passer perfekt.

Mange tak til Paolo Beradi for at vi må bruge hans data her.***************************
Selv med simple instrumenter som Star Analyser kan man prøve at måle udvidelses hastigheden
på skallen af det udkastede materiale.
***************************
Steve Shore siger vi skal holde øje med Cn linjen ved 4216Å (high-res spektroskopi), da det
er indikatoren for støvdannelse.“It is now vitally important that anyone who can cover the 4200-4300 and
3800-4000 A region do so. High or low resolution (well, not too low).
The CN — if it appears — will come around in this next week.” Steve ShoreMed amatørernes hjælp er der næsten 24×7 observationer af novaen. Desværre er echelle spektrograferne
inkl. professionelle, ikke særligt effektive nede i det blå domæne. Derfor er det vigtigt
at man med f.eks. L200, Lhires III eller tilsvarende koncetrer sine observationer omkring
4216 linjen og i 3800-4000Å og 4200-4300Å områderne. Gerne med-res.Stjernen HD196544 er perfekt til bølgelænge og flux kalibrering.
Og lad os så få noget klart vejr.
22. august 2013 kl. 01:08 #106025Som svar til: V339 Del, NYT 29/10 – billeder af novaens ildkugle
Deltager- Neutron star
Opdatering af data fra d. 19. aug.
Har gennemgået data fra den 19 aug. fra min høj kadence serie. Specielt har jeg brugt tid på
at kigge på opblusningen på Ha og Hb emissionlinjerne, jævnfør Steven Shore’s forklaring ovenfor.Til min overraskelse ser jeg tydeligt en stigning i flux på netop Ha og Hb over små 2 timer.
Det havde jeg ikke helt regnet med, da Star Analyser som bekendt er et low-res instrument.Ikke desto mindre er jeg meget overbevist om at det faktisk er korrekt tolkning af
observationer, og de er også helt i tråd med hvad andre har observeret.Nedenfor en animation af Ha området og en graf over Hb området.


Hb emissionen kommer til at se kraftigere ud end den egentlig er, da der er meget
absorption fra andre linjer på hver side af Hb linjen. Igen helt som Steven beskriver.Ændringer i selve linje profiler er så vidt jeg kan se også indenfor det forventede. En
stigning i flux vil p.g.a. den lave opløsning ændre profilen et godt stykke ud fra
centerlinjen.Nedenfor hele kontinuum


For den da, hvor det fantastisk at man med så lille instrument kan lave så meget spændende.
Nedenfor en lille update fra Steven omkring de molekylære støvdannelser vi kiger efter lige nu.
The formation of molecules is an indication that the mass of the ejecta is large and the
local temperatures are low enough that they can form. The CN radical is known from stellar
atmospheres, the Sun for instance, but the densities are higher there at the same temperature.
Its presence also signals an overabundance of C and N relative to the solar values (which
are the fiducials). The dust, instead, is a much later effect when the temperatures are
low enough that solids can be stable. This is something I need to explain in the next
notes because it’s a very general thing that you also see happening in stellar winds and
even supernovae. That’s the cause of the deep decline in novae like DQ Her.In those that reach the same conditions but have different abundances and/or masses, the
dust doesn’t form. We don’t understand the process, and it’s remained an issue for decades.
Since dust in general is a problem in astrophysics, except that we know it can’t form in
the interstellar medium, novae become laboratories for those conditions and even if each
is different we can specify a lot about the environments.steve
21. august 2013 kl. 19:16 #106019Som svar til: V339 Del, NYT 29/10 – billeder af novaens ildkugle
Deltager- Neutron star
En større artikel om hvad vi ser lige nu fra Steven Shore. Meget spændende, en anelse svær, men giv det
en chance, jeg kan kun på det kraftigste opfordre til at man læser det grundigt igennem.Gamma rays fra alm. Nova – standard til at måle afstand?
Hvor langt væk er den?
Kan noget lyse så kraftigt?————————–
As promised (or threatened), here are a few more notes on the latest developments and some further
context-setting.First, to the immediate situation. As many/all will now know, Nova Del 2013 has been in the energy
range above 100 MeV. (Gamma Ray detection). For perspective, it is an energy interval where thermal
processes are irrelevant and indicate something relativistic is happening. More on that in a moment.The detection makes this the second classical nova (third if you count Nova Sco 2012 whose nature
remains uncertain). The other was V959 Mon = Nova Mon 2012, although the gamma-ray detection occurred
while the nova was invisible from the ground due to the Sun.The first detected nova, V407 Cyg = Nova Cyg 2010, was like RS Oph, a recurrent (probably) nova that
exploded within the wind of a red giant companion, so it was a physically very different mechanism
that accelerated the particles to the required energies, although the available energy was ultimately
the same.The luminosity of Del 2013 is about 1/3 to 1/4 that of Mon 2012 at peak. If novae are, somehow, a new
sort of “standard candle” in the gamma-ray range, then that implies a greater distance (a factor of
about 2 at most), placing Del 2013 at around 6-7 kpc. That is a problem since the nova is not in the
plane (Galatic plane – Lars Zielke) and such a distance is uncomfortably far above the height of the
distribution expected for the main population candidates. It also makes the nova particularly
luminous (and that is the next issue).The gamma’s are generated by a variety of processes, all involving accelerating either electrons or
protons to high enough energies that they either scatter visible and UV into the MeV and higher
range, or that the protons collide and emit pions (remember those form the “nuclear glue”, the mesons
that bind nuclei) that decay at around that energy (but not higher). There’s a hint that perhaps the
energy range is more extended and that would favour relativistic electrons scattering photons up to
higher energies (the inverse of the process, known from the birth of modern physics, as Compton
scattering; an electron scatters a photon at low energy but releases it at high energy in the
observer’s frame of reference).Why this is important, is that the origin of cosmic rays has been a headache for almost a
century (since shortly after they were discovered). These are particles that must be actively
accelerated, likely by stellar sources such as supernovae, but the actual process is elusive. If even
little novae can do this, it makes it far more likely that strong supernova shocks — those expected
when their ejecta slam into the surrounding interstellar gas — can work. That makes astroparticle
types salivate and for good reason, we have here something that happens on human rather than Galactic
timescales.The other reason is the likely presence of internal shocks and collisions between fragments of the
ejecta. It’s well known, and you will all see this in the weeks ahead, that the ejecta are hardly
uniform or homogeneous, they consist of fragments of a wide range of density and mass, and these will
be clear once you start seeing multiple absorption components on the main emission lines (e.g. Balmer
series, Na I, Ca II, Mg II, Fe II). But that’s just barely starting and the next couple of weeks will
show what the structure of the ejecta is.If these shocks are slamming into “each other”, the ejecta themselves may be the site of the acceleration
and therefore it becomes a generic(!) phenomenon of novae depending only on the available energy and
mass. We don’t know the answer to this and it’s one of the reasons the measurements of the slow peeling
of the layers in which you’re all engaged is so important.Now the next issue, the luminosity and distance. During this very opaque phase, assuming complete
covering (in other words a sphere of gas around the white dwarf), the ejecta are so efficient at
absorbing whatever photons are emitted — either by the underlying WD or the inner parts of the
ejecta — that we see only what can emerge in the part of the spectrum where there is lower opacity.
That’s the visible and the UV. Most of the light, again assuming a spherical structure, emerges in
the bands in which you’re working — 3000 – 9000A. This is a sort of “calorimeter” or “bolometer”. We
see almost all of the emitted energy shifted into the visible. That’s why the nova brightens in the
first place, the expansion cools the gas and it turns opaque in the UV and almost transparent in the
optical (down to a sort of photosphere). If we measure the total flux in the optical and IR and know
the distance, we have the luminosity (or at least that we’ve intercepted).There’s a sort of limit on the maximum luminosity for any stable spherically symmetric and not transparent
object can have — radiation pressure makes the layers unstable since the acceleration is oppositely
directed relative to gravity. The limit, called or historical reasons the “Eddington luminosity”, is
that which precisely balances gravity for supporting electrons and the lighter absorbers and scatterers.
It’s about 34,000 solar luminosities for a WD of 1 solar mass and increases with mass (that’s because
radiation pressure is really scattering of light with a kick back on the scatterer and since the photons
emerge from below and gravity acts oppositely, there can be a balance point where the accelerations
match; that’s “Eddington luminosity”.If the distance to Del 2013 is the same as Mon 2012, about 3.5 kpc, then this luminosity implies a
mass for the WD of about 1.2 or so solar masses. If it’s greater than 6 kpc, that gets hard to explain.
But it’s not impossible that the nova could have been so bright, one that would be unstable even for
a WD at the mass limit (the so-called Chandrasekhar mass although Chandra was much less massive himself).The catch is that if the ejecta are not spherical, not all of the light will be reprocessed so you
obtain a LOWER limit on how bright the source is/was. Some of the light will not be intercepted. BUT
in the gammas the problem is different and the mass measurement is more reliable, maybe?Now this brings us back to the line evolution and profiles. The line profile is a map of the velocity
with depth in the ejecta and also in 3D. A sphere at any opacity has a different profile than a
bipolar ejection. A sphere, for instance, always has material moving transversely to your line of
sight, a bipolar ejection doesn’t. A central source illuminating a sphere has its photons always
intercepted, a non-spherical ejecta doesn’t, because some photons can escape without any effect
whether emitted centrally or within the ejecta themselves. So the intensity at any radial velocity
(with respect to the observer) maps into a position in the ejecta (but differently depending on the
geometry). We know this from resolved ejecta, but also from, for instance, T Pyx 2011 and V959 Mon 2012.
Some of this is indicated by the ratio of the emission on the profiles compared to the absorption.
You can have pure emission with no absorption for bipolar ejecta oriented at large inclination
relative to the observer or only displaced absorption if the opposite holds.As the ejecta expand, the density drops throughout regardless of the geometry. The part in emission
increases at firs
t because it’s less dense and less opaque. The velocity difference within the ejecta
adds to this, the periphery has the highest velocity so its absorption is shifted relative to the
inner part. At first, if the ejecta don’t recombine, the absorption zone should move inward toward
higher density and lower velocity while the emission increases. That’s what we’re now seeing but
there is a start of the recombination indicated by the Na I D lines and the O I 8446 lines. This will
stop once the ejecta start again to turn very opaque, we’re still in the transition phase you see
after a nuclear explosion when the fireball seems to be shrinking.But unlike the nuclear tests, this is not the static atmosphere but the debris itself that is
changing. As the ejecta get more opaque there should be absorption components appearing on all of the
emission lines and these should seem to move outward (toward more negative radial velocities) as the
wave moved toward the outer regions. At the same time, the ionization will change and the lower
metallic ions (e.g. Fe II) will get stronger. You’ve now seen that staring. Then what happens isn’t
just a temperature effect. The optical depth (the relative opacity) will continue to decline after
total recombination and the matter will start to ionize again.Before all that happens, there’s one more — very brief — phenomenon of importance. If the
density is high enough and the kinetic (gas) temperature low enough, meaning about 5000 K or lower —
the gas can form molecules. The most stable are simple radicals like CO, CN, and CH. In ONE nova, the
dust forming DQ Her 1934, CN was observed just about now relative to the start of the outburst, it
lasted for about a week starting a bout 6a week after the detection. That’s where we are.I have no idea whether this will happen here, but if it does then this will form dust in about 100
days by mechanisms I’ll try to explain soon (it’s beyond your patience and a bit too far in the future
for the moment, I hope you won’t mind).Never forget that the main difference between a nova and supernova in this regard is the survival of
the WD. It is a hot, radiating source that ionizes the ejecta from the inside out (just like a
planetary nebula in fast forward!) so the inner region — the moving photosphere — starts to get
hotter and radiate more in the UV. This drives further ionization of the overlying layers and in
time, the ejecta completely reionize. That’s when the emission lines suddenly appear and there is no
more optical absorption, the so-called nebular stage.When this happens depends on how rapidly the density drops, hence on the velocity and mass of the
ejecta and the luminosity of the WD. In Del 2013, we don’t know that yet. But once the ejecta are
completely transparent, the line profiles give you a complete view of the structure even before the
remnant becomes resolvable (if ever).I hope this hasn’t tired you all out too much. For those who have survived to this point, the next
instalment will come in a few days.Relevante info og links jeg har fundet frem.
Eddington luminosity:
http://en.wikipedia.org/wiki/Eddington_luminosity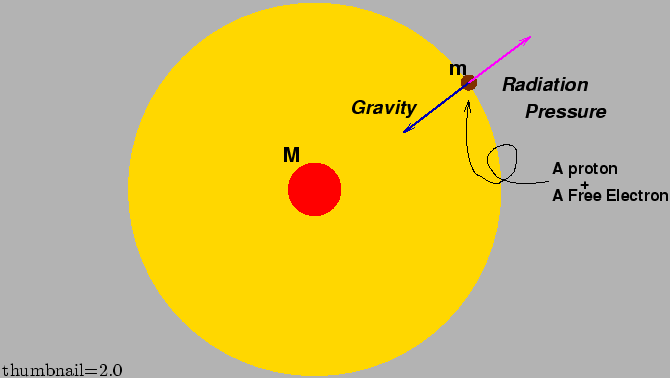
Detection of gamma rays from Nova Delphini 2013 ATel #5302
http://www.astronomerstelegram.org/?read=5302Fermi gamma ray image showing V407 Cyg = Nova Cyg 2010 (Detects ‘Shocking’ Surprise from Supernova’s Little Cousin)

http://www.nasa.gov/mission_pages/GLAST/news/shocking-nova.htmlV959 Mon = Nova Mon 2012: An Unexpected Guest: Fermi-LAT Sees More Novae in Gamma Rays
http://astrobites.org/2013/04/16/an-unexpected-guest-fermi-lat-sees-more-novae-in-gamma-rays/
Knud Strandbæk gør opmærksom på dette fra l’Observatoire Haute Provence 2012
http://www.forum.2astro.dk/forum/topic.asp?TOPIC_ID=7171Pions:
Compton scattering:
http://en.wikipedia.org/wiki/Compton_scattering“>http://en.wikipedia.org/wiki/PionCompton scattering:
http://en.wikipedia.org/wiki/Compton_scatteringDQ Herculis 1934:
http://www.daviddarling.info/encyclopedia/N/Nova_Herculis_1934.htmlNightsky 2013-08-21 19:18:11 21. august 2013 kl. 07:40 #106007Som svar til: V339 Del, NYT 29/10 – billeder af novaens ildkugle
allan_dystrup
Deltager- Nova
Mange tak for dine updates Lars — ekstremt spændende at følge med i !
Allan
21. august 2013 kl. 01:19 #106005Som svar til: V339 Del, NYT 29/10 – billeder af novaens ildkugle
Deltager- Neutron star
I går viste den forøget emission på Ha og Hb, mens P-cyg profilen forsvandt på dem.

Et af over 1000 spektre jeg fik i går med høj kadence spektroskopi. Der er gang i Ha/HbDen vigtige meddelelse er kommet rundt på Atel – Gamma stråler fra Nova Del 2013.
Se http://www.astronomerstelegram.org/?read=5302
Og denne hvor man også konstater en dramatisk ændring ved Balmer linjerne i går aftes. Det ser ud
til at jeg har en del optagelser på dette tidspunkt med 4 sek. interval.http://www.astronomerstelegram.org/?read=5300
However, an LT spectrum of Nova Del 2013 taken at 22:36pm (UTC) 19th August 2013 revealed
that the Hydrogren Balmer series P Cygni profiles have all but disappeared. That is, the
depth of the absorption component has reduced to the approximate level of the continuum.
Subsequent LT spectra have confirmed this change. P Cygni profiles are however still
clearly present in Fe II, He I and O I lines. Follow-up observations at all frequencies
are strongly encouraged.Denne nova er vist allerede nu den bedst observerede nogensinde, amatører over hele verden
har ydet et kæmpe bidrag til dette med spektroskopi og giver næsten 24×7 optagelser.18. august 2013 kl. 23:49 #105922Som svar til: V339 Del, NYT 29/10 – billeder af novaens ildkugle
Deltager- Neutron star
Steven Shore omkring et par spørgsmål jeg havde til ham.
Any indication of the type of accretion star is?
Only one, not too indicative. The pre-outburst image is very blue and there’s nothing on
the 2MAS images. So it’s likely the WD, mainly (I’ll guess) the emission from the boundary
layer of the accretion disk and the disk itself. It was faint but not impossibly so, normal
for a system in “repose”. The lack of a red image means no giant/super giant, so the system
has to be short period (close) with a low mass companion and simple Roche lobe overflow.
Sorry, that’s jargon.The material is coming from the companion being sufficiently close that tidal forcing is
removing the gas and it’s steaming toward the WD and forming an accretion disk. Most novae
are of this sort (in fact, for the symbiotic-like systems, those with giants like
RS Oph, V3890 Sgr, T CrB, and V407 Cyg) there are only six known and all recurrent).It seems that the Nova right now is on plateau in it’s brightness from the photometric
data. Some say it’s maybe not a “fast nova”, but a slow one. How long can we expect the
current state of brightness?Mark Twain (the American Plato, I think) said: predictions are very hard, especially about
the future”. But the likely state will be this plateau for a while, perhaps a week, perhaps
two. It’s hard to say now because the system’s been caught so early (remember that comets
often have this problem). But this could go on for a while.From what I can model of the ejecta it might be that they’re not spherical in which case
the orientation also affects the behaviour.Don’t give up at any cost, even though the weather’s not the best in most of Europe now
it’s important to keep at least nightly monitoring going. And I’ll have more notes
coming
soon.Steve
Yderlig info:
Fra WIKI:
The Roche lobe is the region of space around a star in a binary system within which
orbiting material is gravitationally bound to that star. If the star expands past its
Roche lobe, then the material can escape the gravitational pull of the star. If the star
is in a binary system then the material will fall in through the inner Lagrangian point.
It is an approximately tear-drop shaped region bounded by a critical gravitational
equipotential, with the apex of the tear-drop pointing towards the other star (and the
apex is at the L1 Lagrangian point of the system). It is different from the Roche limit
which is the distance at which an object held together only by gravity begins to break up
due to tidal forces. It is different from the Roche sphere which approximates the
gravitational sphere of influence of one astronomical body in the face of perturbations
from another heavier body around which it orbits. The Roche lobe, Roche limit and Roche
sphere are named after the French astronomer Édouard Roche.
En video der viser hvad man mener der sker ved V407 Cyg – Her ved Nova Del 2013 er det
ikke rød kæmpe/super gigant men noget andet. Videon viser dog fint hvad der sker.Nightsky 2013-08-26 18:17:12 18. august 2013 kl. 23:46 #105921Som svar til: V339 Del, NYT 29/10 – billeder af novaens ildkugle
Deltager- Neutron star
Så er der en masse nyt omkring det vi ser fra Steven Shore (2 opdatering)
At the start of the expansion, at least when we see the nova visibly, the ejecta should pass through
a stage called the fireball. This is an opaque stage that resembles a single expanding surface, or
a sort of thin atmosphere, with an almost uniform temperature.Usually that isn’t observed but in this nova it might have been caught. The expansion velocity is high
enough that the matter can’t radiate efficiently enough to cool by energy loss, the temperature drops
instead because of the increasing volume at constant mass — He energy density is dropping. This is
the same as saying that the total energy remains almost constant but the temperature decreases.Then something important happens. When the matter gets cool enough, first the hydrogen and then
heavier elements start to recombine. This releases some energy (from the excess energy of the
electrons as they’re captured by the ions) but mainly that the neutral and low ionization stages
have much higher line (and continuum) opacities and the absorption in the ultraviolet increases
quickly. The lines that absorb there are the ground state transitions; that is, they’re the strong
zero volt states. Their upper levels are those that both pump the absorption strength of the optical
transitions and excite the levels to reradiate. So the Fe II spectrum, for instance, suddenly starts
to appear. There are coincidences with some of the He I lines, e.g. He I 5016 is close to Fe II
5018, the same for He I 4923 being near an Fe II line (in these cases they’re both from the same
lower level).The lack, in the last spectra, of He I 5875 gives the game away: the triplet series (He I 7065,
5875, 4471) being absent means the stuff at the near-coincidences if Fe II (and other heavy ions).
In the Ondrejov spectra, we have Ca I 4226 yesterday suddenly making an entry. At the same time Ca
II showed higher velocity absorption than the H-beta line. So the ejecta seem to be showing some
depth structure now.What all this means is that we’re watching a stage in a classical nova that hasn’t been covered
since photographic series on DQ Her, the last nova that was bright enough for such coverage in the
modern era, although DN Gem and CP Pup were also well covered (but not like what all of you have
produced!) As I’ve already written, we’re in new territory here — between observational
capabilities and opportunities to catch individual events.So it’s important that you keep up your courage and bang away. It is possible that within the next
week there’ll be a short-lived absorption stage in CN 4216 (and also 3883). In the IR there should
be a CO 2 micron emission stage. If the nova isn’t a DQ Her type, then we really have no analogy.The continuing fluctuations in the photometry, also known from other novae at maximum light, remain
a very deep problem and, again, any observations with the highest possible cadence (this also means
longitude coverage from all of you to get the most continuous sequences) will be critical. For
instance, the disappearance of the He I corresponded to a “local” peak in the optical light, this
could be a recombination event or it could be multiple ejections. To speculate, so early, is too
risky (even for a theorist!) so I’ll stop now and hope this explains the stages you’re seeing.One more point, though. The recession of the absorption velocity is something also known from the
DQ Her outburst, this is an effect of the change in the transparency of the ejecta. If this is the
effect of seeing deeper into the layers at first during the late fireball, then it should reverse as
he recombination sets in and the ejecta cool.
_
Steve ShoreMan kan evt. Sagtens selv være med uden at lave optagelser. Man samler pt. amatør spektrografiske
målinger her, lige til at downloade og analysere. Brug evt. Visual Spec og du er i gang
med det samme.
http://www.astrosurf.com/vdesnoux/index.html
DQ Her – vi ser de ekspanderende skaller af gas omkring DQ Her. Disse skaller er på vej
væk fra det binære par med omkring 1.000 km / sek.En stor tak til Steven for at han giver sig tid til at informere amatør astronomerne, også i Danmark.
Nightsky 2013-08-18 23:47:43 -
ForfatterSøgeresultater