› Fora › Søg i forum ... › Søgeresultater for 'V339'
-
ForfatterSøgeresultater
-
27. marts 2021 kl. 23:01 #327159
 Kompedal StarpartyDeltager
- Main Sequence

Kompedal Star Party Zoomer ind
D. 7. april kl. 19:30Novaer, de klareste og mest hyppige stjerners udbrud i galaksen
ved Astrofysiker Steve Shore
Image credit: NasaVi får næsten dagligt besked om at der nu er observeret en ny nova I en eller anden galakse, og nogle gange er vi så heldige at en nova viser sig I vores egen galakse, Mælkevejen. Lige nu har vi en meget klar nova i stjernebilledet Cassiopeia som kan ses selv med en ganske lille håndkikkert, så emnet nova’er er ganske aktuelt. Steve Shores foredrag vil give os et indblik i hvad der sker når disse voldsomme udbrud sker, så man får viden om hvad det er man observerer og følger.
Et foredrag om nova’er ved Steve har været højt på ønskelisten siden 2013, hvor han skrev en lang række artikler til os amatør astronomer omkring Nova Del 2013. Disse artikler kan findes Astronomisk Selskabs fora http://forum.local/forums/search/V339/ søg efter “V339” hvis du ikke bruger linket.
Steve Shore har studeret klassiske og tilbagevendende novaer, gennem mange år, for at forstå deres eksplosive og støvdannede processer, stjernevinde og stråling. Han udgivet mange videnskabelige artikler og skrevet bøger, bla. The Tapestry of modern astrophysics.
Bemærk: Foredraget er på engelsk.
Zoom møde detaljer
Emne: Novaer ved Astrofysiker Steve Shore
Bemærk: Foredraget er på engelsk.
Tid: April 7, 2021 19:30 CDeltag i Zoom Meeting
https://zoom.us/j/94288847666?pwd=RXZaakp1Q0UvMGYzR1prMzg1TjlwZz09Meeting ID: 942 8884 7666
Passcode: 402035Youtube video Nova: https://youtu.be/a4smDVvECaQ
Kompedal Starparty
29. oktober 2014 kl. 22:10 #123616Som svar til: V339 Del, NYT 29/10 – billeder af novaens ildkugle
nightsky
Deltager- Neutron star
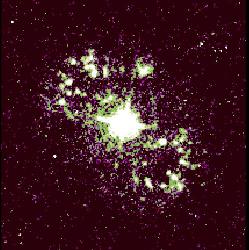
Sådan – det er bare så smukt at der bliver ved med at komme nyt om den Nova Del 2013.
Det er ganske simpelt utroligt at man kan gøre dette på en afstand af 14.800 lysår.For første gang har man taget billeder af en nova i den tidlige ildkugle fase og afsløret hvordan
strukturen af det udkastede materiale udvikler sig som gassen ekspanderer og afkøles.CHARA Arrayet brugte optisk interferometri til at kombinere lyset fra 6 teleskoperfor at opnå
den høje opløsning, svarende til et teleskopet med en diameter på 300 meter, en opløsning
som er langt bedre end almindelige eller rumteleskoper.http://www.nature.com/nature/journal/vaop/ncurrent/full/nature13834.html#figures
Hvis nogen har adgang vil det være super med en kopi….Nu skal jeg selv i gang med at plotte mine egne data op model disse nye billeder. Super…
Georgia State Astronomers Image the Exploding Fireball Stage of a Nova
Astronomers
at Georgia State University’s Center for High Angular Resolution
Astronomy
(CHARA) have observed the expanding thermonuclear fireball
from a nova that erupted last
year in the constellation Delphinus with
unprecedented clarity.The observations produced the first images
of a nova during the early fireball stage and
revealed how the
structure of the ejected material evolves as the gas expands and cools.It appears the expansion is more complicated than simple models
previously predicted,
scientists said…………………
Animation af ildkuglens udvikling.


Nightsky 2014-10-29 21:10:40 1. januar 2014 kl. 18:49 #112376Som svar til: V339 Del, NYT 29/10 – billeder af novaens ildkugle
Deltager- Neutron star
Afsluttende bemærkning for 2013.
Det har været meget spændende at følge og lære om Nova Del 2013 i dette efterår. Vi har alle kunnet følge
novaen, visuelt, fotografisk, med fotometri, med spektroskopi eller bare ved at læse på forum. Og nogen
har gjort det i en eller anden udstrækning. Antallet af visninger for artiklerne har rundet 11.000 – 7.500
på astro-forum og 3.500 på Astro’s forum. Jeg kan hilse fra Steve Shore og sige at det gør indtryk. Ganske
imponerende for et lille land som Danmark.I det kommende år vil der ind imellem komme nye artikler om V339, om Nova Cen 2013 og kommende novaer.
Jeg har bedt Steve om forsætte med at sende opdateringer, så vi også i dette nye år kan lære en masse.Desuden håber jeg personligt at flere kommer i gang med spektroskopi. Selv opgrader jeg voldsomt og jeg
tror der er par stykker mere som vil gære det samme. Høj frekvent spektroskopi blev i 2013 beviseligt en
disciplin som kun amatør astronomers kan mestre – godt gået af ARAS gruppen.I 2014 arbejdes der på at foredrag omkring Nova Del 2013 med Steve Shore (via Internet) – Jeg håber det
lykkes at få sat dette op snarest.Hvis man vil sende en hilsen til Steve kan man blot skrive det her, så skal jeg samle dem sammen og sende
videre.Hermed også et godt nytår fra Tvis.
Lars ZielkeArtikel #19 28 dec. 2013
Steve ShoreHvad har vi sammen set og lært af V339 (Nova Del 2013)
So we arrive at the end of the year and of the visibility of V339 Del for this year. It should come
out from solar avoidance again in March. In the interim, as you all know, in this past month it’s
been surpassed – in brightness – by V1369 Cen, discovered about four weeks ago. Before continuing,
there is one important thing to note here: without this campaign, V1369 Cen would be studied in a
vacuum.In the past month, during the last stages of fading of v339 Del, we’ve seen – finally – the higher
ionization stages of the ejecta. From your spectra and from the NOT, there are indications of the
[Fe VII] 6087Å line as early as mid-No. but this is now clearly present and will be the “line to watch”
in the months after emergence from solar obscuration. The He II 4686Å line is strong and of a
similar profile, indications that the ionization and emission are still powered by the continuum
of the central engine (the WD). Now, depending on the development of the X-ray emission – whether
the source is still “on” when we see the nova again in the early spring or has shut down and is in
the cooling phase – the ionization of the ejecta will display changes dominated by the interplay of
expansion and photo-processes.Perhaps now we can reflect on what we don’t know from all we’ve collectively seen and learned from
this nova because it prepares us collectively for all those to come.
Figure 1: Further comparison of [O III] 5007 and N V 1240Å profiles from 2013 Nov. 21.
Note that the N V is a doublet and that the individual components more likely have the
He II-like profile than these forbidden transitions. The absorption features are Mg II
interstellar lines.For V959 Mon 2012 we had the disadvantage of not having seen the peak of the outburst, the mirror image
of what’s happening now for V339 Del. Having missed the Fe-curtain phase, we did not see the earlier
optically thick stages of the ejecta that probed the recombination following the fireball. Instead,
for V339 Del, we have an exquisite picture, in minute detail, of every moment of that period. It
shows that many of the phenomena seen in the earlier outburst of the recurrent nova T Pyx, in 2011,
are not peculiar to that system but actually generic. The structure that you observed in the absorption
troughs of the P Cyg lines, the disappearance and then re-appearance of the detached absorptions on
the He I profiles, the Na I doublet complexity, are all standard features. Now, for V1369 Cen, we’re
seeing the same thing, albeit with more complex structure and higher velocities. But why? What imposes
this feature of the ejecta? The narrow lines are well known from other novae but the optical depth
changes show that what starts out as a broad (hundreds of km s−1) feature decomposes on a drop in
column density into an ensemble of individual components. It appears that the filamentary character
of the ejecta is far more complex than it seemed. But there is larger scale structure, otherwise we
wouldn’t see these distinguished features. The same lines appear on the Ca II H and K lines, ion
resonance lines, as Na I, despite these being different ionization states they are both from high
column density, low temperature gas. Again, why? There has to be something pointing back to the
explosion.
Figure 2: How to probe the ionization stratification of the ejecta using lines of
nitrogen (there’s a good sampling from the UV) from 2013 Nov. 21.In V1369 Cen we’re seeing a very complicate light curve, one that is reminiscent of T Pyx in its
excursions in V. The gamma-ray emission we saw in V339 Del, and V959 Mon (remember, this character
was first seen in very high energy emission months before it as detected optically, was confined
to a brief interval near peak. For V1369 Cen that’s not so clear. But perhaps the difference in
the photometric development – along with the line profile changes – will allow an eventual resolu-
tion of the structure question.The second is for the future. V339 Del was spatially resolved very early, within a week of outburst,
at optical and near infrared wavelengths. That data has yet to be digested thoroughly but for now it
seems consistent with different interferometers (CHARA in the north, VLTI in the south) found different
expansionrates that could indicate an axisymmetric (bipolar) sort of structure. When the nova emerges
again, it will be after almost as long an absence as its presence, so it should be considerably more
extended and maybe accessible to direct imaging from ground based telescopes like the Keck, VLT, or
Gemini. The same is true for V1369 Cen, although there is no northern partner to provide that infor-
mation. It isn’t unthinkable that a direct comparison will be possible with HR Del 1967, for which
HST/WFPC2 images were obtained in the ’90s (nearly 30 years after outburst). Remember, once the central
source ceases to control the ionization the gas continues to radiate by recombination, although
always more weakly, so the line emission traces electron density. The advantage of brightness, of
nearness of the nova, is purely geometric – the closer it is, the easier the resolution of the ejecta.
The same holds for the radio, interferometric observations of V339 del are the basis for interpretation
of the more sparsely sampled V139 Cen cm-wavelength data.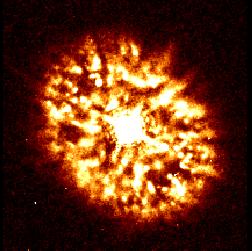
HST/WFPC2 billede af HR Del (Nova 1967) i H-alpha (venstre) og [O III] (højre) – Tilføjet af mig.The third is sill open: there is now accumulating evidence that V339 Del really did for dust although
it isn’t yet clear how much. The latest observations, by Fred Walter using near infrared spectra, is
in strong support of that contention from earlier bolometer photometry in the IR by the Minnesota
group. How much and where, and when isn’t known – yet – but you all worked like daemons to cover the CN lines during the optically thick stages and nothing emerged. Neither was CO observed in the IR as
it was for V705 Cas. So there is a crack in the edifice, perhaps molecular precursors are not necessary
– or are not visible – if the ejecta have the right geometry. The dust didn’t produce a DQ Her-type
event, but the ejecta aren’t spherical, so now to see what happens in V1369 Cen. I wish I could give
you all a neat summary of this but its new territory, as we’ve seen so often in this nova.The line profile changes in the last month for V339 Del trace the electron densities. There is a hint
of the [N II] 6583Å line (the analog of [O III] 5007Å) on the wing of H_ and a first trial in getting
the electron density by using the ratio [N II] (6548+6583)/5755, along with the tracer [O III]
(4959+5007)/4363, gives a limit on the density in the range between -1000 and 1000 km s−1 of (6 −10)×106 cm−3
but the temperature is uncertain. the mass is a few times 10−5M⊙ and a large filling factor seems to
be emerging, but these statements are still very preliminary. The filaments that you’ve all noted are
not only still there but now more evident and on lines of different ion stages and elements – so it’s
now possible to study the homogeneity of the abundances in the ejecta at the level of a few percent of
the volume. OK, this is a technical point but by combining the emission from lines whose de-excitation
is from collisions with electrons in the ambient gas and otherwise only radiative de-excitation, the
branching ratio (ratio of the different “exit channels” for the photons) shows the competition between
the rates of collisional de-excitation and radiative decays for the excited states. The advantage of
these two indicators, even if they arise from different ions, hence from different parts of the ejecta,
is that they’re similar enough that the differences can be understood by using the line profiles.You see, that’s why spectra are so important – in such rapid expansion, with so large a velocity
difference between the inner and outer parts of the ejecta – every piece of the volume leaves its
radiative imprint projected along the line of sight. So if two profiles are similar in structure,
they come from the same places in the ejecta and the differences are because of the peculiar sensiti-
vities to the ambient conditions of the transition in question. None of this is hand waving – we
have now the necessary plasma diagnostics to proceed systematically with the time dependent analysis
of the ejecta.Here we turn again to the homogeneity problem: is the gas well mixed or not? What happened during the
explosion?? If V1369 Cen is showing multiple ejection events, the comparison with V339 Del will be an
incredible chance to see if individual events are similar in the nuclear waste produced and expelled.
We can, irrespective of whether V1369 Cen is a CO or ONe nova, to do a quantitative compare-and-contrast
analysis with any of the subtypes based on the last three years of novae. Here I really mean we,
you’re all part of this! Those observing (ARAS gruppen) V1369 Cen now, those who have followed with such
zeal V339 Del.
Figure 3: The spectra from V339 del (NOT) and V1369 Cen (ESO, FEROS from Luca Izzo) on
about the same day (about three weeks) into outburst. The fluxes are absolute, the scaling
is 3x for V339 Del, no extinction corrections (but you’ll notice that the spectra are so
close that it’s likely the reddening is similar).This has gotten very long and it’s really only the beginning. The pair will remain visible for years
at a level accessible even with small telescopes, albeit at low resolution. It will be worthwhile
trying to restart observations when V339 Del re-emerges, we don’t know what it will be in V at that
time. And now it’s time to reflect on all that’s been accrued in this spectacular archive and begin
the detailed analysis. You’re all part of that now (ARAS gruppen). For those who have had the stamina
to reach this point in the notes, for a whole community that has reaped the rich rewards of your
collective effort, sincere thanks from the heart for all you have done. The first paper is now being
outlined, that will be sent around to you, and summaries of the analysis will be coming in the next
month. The new year begins with a new era in the study of this elusive phenomenon.You are all the ones (ARAS gruppen) who have made that possible, turning voyeurism into a fine art
through spectroscopy and thought.Best wishes for the holiday and very best wishes for the New Year.
—–
Steve Shore1. januar 2014 kl. 16:44 #112370Som svar til: V339 Del, NYT 29/10 – billeder af novaens ildkugle
Deltager- Neutron star
Nogle bemærkninger til sidste artikel #18
I artiklen ovenfor har jeg markedet stederne med fed
(1)
A clarification here, 30/11/13: the slope changes near the peak of the function so it you have a
steep variation it means you’re closer to the peak (OK, better said, the long wavelength limit
depends on the temperature, that is B(T) T so at a fixed wavelength the slope of the function
depends on the temperature. It’s better to leave it out, just enough to mention that the slope
at any frequency depends on the ratio of the frequency of observation to that of the maximum
(in that sense at max T so you can use this to indicate if the peak is near or far from the observation.(2)
A clarification after a question by Francois: In the T Pyx spectra, after day 170, there were
detached (high velocity) discrete (narrow in velocity, dV/V 0.1) absorption lines on the profiles.
These remained at the same velocity when seen in absorption, much later, in ultraviolet spectra
at C IV and N V. The thing I’m talking about here is that in V339 Del we have not (yet) seen
this, but it may be what the XR is showing (so we’re seeing the structure probed by a different
set of ions now, perhaps in the next HST spectra we’ll see this on the other lines). In the last
T Pyx paper (the one called paper III in the series in A&A) the pumping is due to EUV and XR
absorptions, at energies of 50-100 eV. The lines, in other words, that are in absorption (which
are reported as He-like and H-like, i.e. C+5) are the transitions that should show this without
an optical or nearer UV counterpart (they’re too ionized) but could be showing up in the FUV
(e.g. O VI instead of O V).21. december 2013 kl. 19:23 #111975Som svar til: V339 Del, NYT 29/10 – billeder af novaens ildkugle
Deltager- Neutron star
En lille jule hilsen fra Nova Del 2013 (V339) og den nye nova Nova Centauri 2013 (V1369)
Nova Cen 2013 er vist den 11 klareste som er observeret.
Nova Del 2013 (V339) er stadig på plateau fasen ~mag. 11.25 og der sker ikke mange ændringer i spektret lige nu.
Nedenfor en sammenligning mellem V339, V1369 og V705 (Nova Cas 1993) på samme udviklingstrin ved Na I så man kan se hvor ens forskellige træk er.
Alle CO (kulstof-ilt) WD (hvide dværge), som V705 Cas udvikler store mængder støv omkring 90 dage henne i forløbet.)Jeg har nogle flere spændende noter på vej fra Steve Shore, så hold øje med denne tråd de næste dage.

Nedenfor en sammenligning mellem Nova Del 2013 (V339) NOT data og Nova Cen 2013 (V1369) Chiron data,
på samme udviklingstrin over en stor del af det visuelle område.


PS:
Chiron er en echelle spektrograf på SMART 1,5 meter teleskopet. Lyset sendes til via fiber.Lidt data:
Spectral resolution R~ 80000 (with image slicer: normal or Iodine mode) / 25000 (fiber mode)
Spectral range 410-870 nm, fixed
Total efficiency ~6%Placering:
Cerro Tololo Inter-American Observatory, 500km nord for Santiago, Chile, elevation 2200 meter.
Nightsky 2013-12-21 18:31:16 1. december 2013 kl. 01:16 #110886Som svar til: V339 Del, NYT 29/10 – billeder af novaens ildkugle
Deltager- Neutron star
Artikel #18
Steve ShoreHubble, XMM/Newton, NOT og ARAS data.
Ser vi en gendannet tilvækstsskive? Støvet er måske ikke observeret alligevel..—–
It’s been too long since I last wrote, and there have been significant developments to
explain. As ever, the collective contributions (ARAS gruppen) are wonderful, it is especially
important to see the move to also obtain spectra longward of Halpha.We are now well into the nebular phase. The emission lines of all species show ionization-
dependent structures but within a single ion the profiles are the same. This maps the ejecta
structure and leads to a three dimensional view that is especially important (for instance,
in comparison with HR Del 1967 for which the ejecta are superbly resolved). A STIS/HST
spectral sequence (1150 – 3050A) with a resolution of > 30000 was obtained simultaneously
with a NOT observation (3700-7400A), an XMM/Newton XR pointing, and a number of your spectra.
What’s emerged from the UV is that the emission lines are all asymmetric, with profiles
similar to that seen in the optical (with the -1000 km/s peak stronger or dominant relative
to +1000 km/s; for [O II] only the blue is seen) and that all of the ions with ionization
potentials above He I (about 25 eV) have the same profile. There are no absorption lines
other than interstellar, but those are a key to setting the continuum level since they’re
purely absorption and entirely foreground (not in the ejecta).
This shows that a continuum, seen in the optical, is present and strong in the UV. At this
stage, it’s likely a mix from the white dwarf and the thermal emission from transparent
gas in the ejecta. If it’s due to the WD, which is now a strong (but as of today slowly
declining) supersoft source (SSS), then it indicates an intermediate temperature since
the slope in the UV band is quite visible. As a side note, the hotter the central source
the more uniform the continuum in longer wavelengths will be singe the strongest change
is near the maximum (1) . While for now this seems just a technical point, but it’s much more.
The UV+optical luminosity, if a distance of 4+/-0.2 kpc is assumed (which we have from
the comparison with OS And 1986) and a reddening of E(B-V)=0.2, then the luminosity is the
entire spectrum at lower energy than about 13 eV (i.e. roughly the ionization of neutral
hydrogen) is only about 2000 L_sun or less. The X-Rays are very bright; the reported
uncorrected integrated flux from Chandra is about equal to the UV/optical corrected value,
so it must be much stronger. A hopelessly naive assumption, that the emission behaves
like a blackbody, provides a clue (but one to take — as for any comparison with a Planck
function — with much caution) is that only about 5% of the flux has been measured in the
longer spectral interval so the luminosity could really be quite high. In the absence of
any spectral indicators of the WD temperature (or even presence other than the X-Rays) it’s
still a “to be seen eventually”. Some lines might be masked by ejecta emission, for instance,
but that could remain true for months to years.You might be wondering if an accretion disk has reappeared yet. The 0.1-10 keV range
(reported for Chandra observations by Nelson and collaborators) shows nothing in emission!
OK, there’s a reported continuum but there are no P Cygni type lines (indicative of a
stellar wind). On the contrary, strong absorption was seen (this about a week before the
STIS observations). That’s not so remarkable if it is photospheric, but all lines are blue
shifted (!) by 1000 km/s or so.Strangely, this is the same velocity at which we see the asymmetric emission peaks. So
think of what would happen if the outer ejecta, which have lower number density and higher
expansion velocity, are nebular (transparent) but the inner, hotter parts of the ejecta
are still marginally optically thick in the lines. Then what you should see are lines shifted,
uniformly and completely, to the velocity of the inner ejecta. In this case, it’s reasonable
to take 1000 km/s. Thus, and this seems to very lovely part of the future work, as these
features turn from absorption (by absorption I also include optically thick resonance
line scattering) to optically thin emission, we will get a new, independent estimate of
the mass and abundances in the ejecta. To encourage you, the Chandra and XMM/Newton data
have about the same resolution in X-Rays that you are getting in the optical. I may have
mentioned that in T Pyx this was detected only very late, after 300 days, and here we have
nothing in the intermediate ions (e.g. N IV]1487, N IV]1718) that we saw in detached
absorption features, but it’s a new and essential probe of the ejecta (2). If this works, it
will allow precise information to be obtained about heavy element abundances, the yields
from the explosions, the correctness of the nuclear reaction modelling (nucleosynthesis
is the sort of radioactive waste from a reactor gone bad, as you all know). There’s been
one claim that dust formed (when have you heard that one before?) but it’s likely a red
herring (we’ll know once there’s a SOFIA flight, the aircraft is grounded now for engine
problems).So what we have is: excited state transitions: O V] 1371, N IV] 1718, He II 1640; some of
the strongest UV transitions detected: N V 1240, O I 1302, C II 1335, N IV] 1486, C IV 1550,
He II 1640/2733, O II] 1667, N II 2143, C III 2297, O II 2470, O IV 2510/2517, Mg II 2800,
C II 2837, F III 2932. The complex blend at 1400 is primarily O IV 1401 but likely has a
contribution from S IV; the Si IV doublet is absent.There’s nothing particularly remarkable about the nova properties, the electron density
is now about 1E7/cm^3 (so still marginally high), there’s an indication that the filling
factor (the knottiness of the ejecta, as seen on your profiles of Halpha, for instance),
is about 0.1-0.5 (in other words, not large, not small, intermediate), and the ejecta
mass is about a few 10^-5 M_sun, consistent with other classical novae but that will become
more precise soon. Once this is all over, the next step is the detailed abundance analysis,
he line profile modelling, and the write-up of the first paper.Your spectral sequences will be the check against which all detailed modelling will be
done since the density, quality, dispersion, and coverage make then precious. There are
now Hamburg Remote Telescope observations (between 15000 and 20000 resolution with 3700 to
9000 A coverage in two groups of echelle spectra), about 20 days in the sequence from
30/8 to 7/11, but without your data, well enough said.I’ll stop now, and some spectral plots will be coming soon.


Steve
Links
Hubble Space Telescope Space Telescope Imaging Spectrograph
http://www.stsci.edu/hst/stis/
XMM-Newton satellit
http://xmm.esac.esa.int/SOFIA NASA
http://www.nasa.gov/mission_pages/SOFI
A/#.UppuDCdFYyUNightsky 2014-01-01 15:40:26 30. november 2013 kl. 21:21 #110880Som svar til: V339 Del, NYT 29/10 – billeder af novaens ildkugle
Deltager- Neutron star
Støv målt i det infrarøde områdeAtel 5604
2.3-11.6 Micron Measurements of Nova Del 2013 Consistent with Presence of DustATel #5604; A. C. Cass, R. L. Carlon, D. T. Corgan, D. A. Dykhoff, R. D. Gehrz, R. D. and
D. P. Shenoy (Minnesota Institute for Astrophysics, Minneapolis, MN, USA)on 27 Nov 2013; 00:32 UT
Our 2.3-11.6 micron measurements of Nova Del 2013 on 24.04 November 2013 UT using an As:Si
bolometer mounted on the 0.76-m infrared telescope of the University of Minnesota’s
O’Brien Observatory (Marine on St. Croix, Minnesota, USA) yielded the following magnitudes:
K = +5.24 +/- 0.15, L = +3.25 +/- 0.38, M = +2.00 +/- 0.26, [10.3] = -0.17 +/- 0.38, and
[11.6] = -0.19 +/- 0.21. An additional measurement on 19.08 November 2013 yielded [10.3]
= -0.10 +/- 0.36. Co-addition of the data from the two nights gives [10.3] = -0.13 =/-
0.26. The measurements are consistent with the presence of a dust shell with a temperature
of ~720K emitting about 10% of the outburst luminosity. Our observations were made possible
by a generous gift from Edward Glickman and technical support by A. Knutson and J.
Marchetti.Nightsky 2013-11-30 20:22:06 30. november 2013 kl. 21:15 #110877Som svar til: V339 Del, NYT 29/10 – billeder af novaens ildkugle
Deltager- Neutron star
ATel # 5593
Chandra observations reveal a rich absorption line system in the supersoft X-ray spectrum
of V339 Del (Nova Del 2013)ATel #5593; T. Nelson (Minnesota), K. Mukai (NASA/UMBC), L. Chomiuk (MSU) and J. Sokoloski (Columbia)
on 22 Nov 2013; 23:22 UTFollowing the report of the emergence of a bright supersoft X-ray source in V339 Del (see
ATEL #5505), we obtained a high resolution X-ray spectrum of the nova with the LETG/HRC-S
instrument on board the Chandra observatory starting on 2013 November 09.75 (88 days
after discovery). The observation had a net exposure time of 46 ks, during which the source
was detected in the 22–44 Angstrom range with a mean count rate of 21 (24) cts/s in the
+1 (-1) order light. The nova did not exhibit the large scale variations in count rate
previously detected by Swift (ATEL #5573), and a preliminary timing analysis did not find
the 54 s QPO in the power spectrum.The high signal-to-noise Chandra spectrum reveals a rich system of absorption lines
superimposed on a supersoft continuum source – no emission lines are present. We identify
the deepest absorption features in the spectrum as lines of hydrogen- and helium-like
carbon and nitrogen, and the strongest lines appear to be blue shifted by ~1200 km/s.
Other weaker absorption lines are also present. We detect no X-ray flux at wavelengths
shorter than 22 Angstroms—the total observed flux in the energy range 0.1 – 1 keV is
2.8e-9 erg/s/cm^2. Modeling the data as a simple absorbed blackbody, we find an
interstellar absorbing column of 1.8 x 10^21 cm^-2, and a photospheric temperature of 27 eV
(~310000 K).
However, we caution that the model fit is statistically poor and that blackbody fits to
supersoft spectra in novae are known to substantially underestimate the temperature.30. november 2013 kl. 19:18 #110865Som svar til: V339 Del, NYT 29/10 – billeder af novaens ildkugle
Deltager- Neutron star
Atel #5573 – Variation af super-soft røntgen stråling.
Large amplitude super-soft X-ray intensity variations and a 54 sec QPO in Nova Del 2013 (V339 Del)
ATel #5573; A. P. Beardmore, J. P. Osborne and K. L. Page (U. Leicester) on 12 Nov 2013; 15:53 UT
In ATEL #5505 we reported the rise of the super-soft X-ray source in Nova Del 2013 (V339 Del)
seen by the Swift XRT. Since the last observation reported there, at 1.5 c/s on day 70.8
after outburst, the soft X-ray count rate has risen to a peak count rate of ~100 c/s on
day 87.9 (10 Nov). All count rates are from grade 0 events only. The rising count rate
was interspersed by a few large dips, one of which reached down to <1% of the count rate
one day earlier. Since day 84.6 (7 Nov) the interval of large amplitude variations appears
to have ended, with no variations larger than a factor of two up to the most recent observation
on day 89.7 (12 Nov).We have searched XRT WT light curves for variability on shorter timescales. An FFT analysis
of the data from day 77.5 to 88.6, in which power spectra of 40 intervals of data of
duration 409.6s at 0.1s binning were averaged, has revealed the presence of a quasi-
periodic oscillation (QPO) and low frequency noise (LFN). Fitting the averaged power
spectrum with a power-law for the LFN, a Gaussian for the QPO and a constant for the
statistical (i.e. Poisson) noise gives a best fit QPO period of 53.2 +/- 1.2 sec, a QPO
FWHM of (3.5 +/- 1.7)e-3 Hz and a LFN power law index of -1.44 +/- 0.16 (where the errors
are 1-sigma). The strongest detection was on day 88.0; the QPO is seen in the remaining
data at a level 4 sigma above the LFN. The coherence as measured from the average power
spectrum is ~12 cycles. The average power in the Gaussian corresponds to a fractional
r.m.s. of 2.5%. Although not detected in all observations, individual sections of data in
which the QPO is clearly visible (e.g. day 84.4 and 88.0) show a sinusoidal-like
modulation with fractional amplitudes up to 6%.The large amplitude variation in the super-soft flux is very similar to that seen from
the recurrent/classical novae RS Oph, KT Eri, and V458 Vul (Osborne et al. 2011 ApJ 727,
124, Schwarz et al. 2011 ApJS 197, 31). Its origin is not certain, but may be due to
clumps in the ejecta causing variable and possibly ionised absorption (Ness et al. 2007
ApJ 665 1334) or white dwarf photospheric temperature variations (S11). The QPO detected
here is also similar to one seen in RS Oph at 35 sec by the XRT (O11) and XMM (N07), and
in KT Eri also by the XRT at 35 sec (ATEL #2423). The origin of this short-period QPO is
also not certain, possibly being related to either the spin of the white dwarf or an
oscillation in the nuclear burning rate.Nightsky 2013-11-30 18:19:23 30. november 2013 kl. 19:10 #110864Som svar til: V339 Del, NYT 29/10 – billeder af novaens ildkugle
Deltager- Neutron star
Artikel #17 (2013-11-23)
Steve ShoreModelling the ejecta
…. I ran a model for the [O I] and used it to see if the asymmetry in the profile could
be quantified. That’s the enclosed figure. Using the usual maximum velocity, 2500 km/s
(from the UV) and comparing with the observation from the NOT on 28/10, something interesting
comes out.There wasn’t an attempt to fit things precisely. This time I used the raw data from the
model (no sum, no smooth, so this is one statistical realization). If you normalize and
subtract the profiles then the lowest density region is on the red side; this is opposite
the Hbeta and Balmer profiles (and others too). So it seems to be a clue to the
asymmetries in the ejecta. Again the inclination is moderate, I haven’t yet done the full
radiative transfer solution but that will come after we have the STIS spectrum. As usual,
I’m sort of shocked when the models work so well, they really shouldn’t be so precise!
The plateau phase
For the plateau phase, there can be several reasons, all of which are connected with the
interplay of the illumination from the WD and the expansion. The density is dropping but
the ionization is increasing so there is a point where the emission lines (depending on
which) can remain constant. The higher ionization stages will be like this, your plot of
the [O III] is a good example. We don’t yet have access to the He II cleanly from the
ARAS data, that’s one of the hopes for the NOT and Ondrejov spectra (to separate the
profiles). If the [N II] is constant, the N III 1751 and N V 1240 should be increasing.
The anomaly is always O I but the change in the 8446 line is important. An interesting
feature of the XRs is that they’re now very stable, nothing like the coronary we saw
earlier in the month.About novae ligh curves :
http://iopscience.iop.org/1538-3881/140/1/34/pdf/aj_140_1_34.pdfSoft X rays light curve from SWIFT

Observing: reformation of the accretion disk
There are two things that will be important to see now, and you all are in the position
to see it.The Halpha is so broad that he [N II] 6548, 6583 doublet is masked. That leaves only [O III]
as a density indicator. But in the next weeks, before the nova is inaccessible, there
could be evidence for the reformation of an accretion disk.Even low resolution data will be important here. The He II line is important, but the
continuum is too. If the weather ever clears this is worth calibrating, a signature is a
rise toward the blue. We haven’t seen this with certainty in any nova to date but it has
to happen sometime!12. november 2013 kl. 23:27 #110031Som svar til: Boble nær ngc6820/6823 nyt spørgsmål
Deltager- Neutron star
Jo selvfølgelig er det hygge/sjovt Thomas. Men det svinger tit mellem at være ganske berigende og voldsomt frustrerende.
Jeg tror aldrig jeg har læst, regnet, søgt og tænkt så meget astrofysik som i i dette efterår. Nova Del 2013 og Steve Shore satte virkelig gang i noget og sidenhen kom Jacob’s objekt oveni.
 Heldigvis er der meget der gælder for begge.
Støv, støv og atter støv vil jeg mene er temaet for mit efterår. V339, Jacobs boble, mine meteoritter – det hele hænger nøje sammen som om der er en stor rød tråd bag det hele. Jeg mangler bare lige at finde og forstå det sidste… det er lige om hjørnet, eller om det næste hjørne eller det næste…..??????????
Og her skulle dette efterår være tilegnet studier af meteoritter, noget astrobiologi samt færdiggørelse af NGNT teleskopet.
 5. november 2013 kl. 10:17 #109651
Som svar til: V339 Del, NYT 29/10 – billeder af novaens ildkugle
Deltager- Neutron star
The Astronomer’s Telegram
Continuing spectroscopic observations (3600-8800A) of V339 Del = Nova Del 2013 in the early
nebular stage with the Nordic Optical Telescope, Ondrejov Observatory and the ARAS groupATel #5546; S. N. Shore (Univ. of Pisa, INFN-Pisa); J. Cechura, D. Korcakova,
J. Kubat, P. Skoda, M. Slechta, V. Votruba (Charles Univ. and Astronomical Institute,
Academy of Sciences of the Czech Republic- Ondrejov, Czech Republic); K. Alton, D. Antao,
E. Barbotin, P. Berardi, T. Blank, P. Bohlsen, F. Boubault, D. Boyd, J. Briol, Y. Buchet,
C. Buil, S. Charbonnel, P. Dubreuil, M. Dubs, J. Edlin, T. de France, A. Favaro, P. Gerlach,
O. Garde, K. Graham, D. Greenan, J. Guarro, T. Hansen, D. Hyde, T. Lemoult, R. Leadbeater,
G. Martineau, J. P. Masviel, B. Mauclaire, J. Montier, E. Pollmann, M. Potter, J. Ribeiro,
B. Schramm, O. Thizy, J.-N. Terry, F. Teyssier (contributing participants, ARAS)on 5 Nov 2013; 01:12 UT
Credential Certification: S. N. Shore
Subjects: Nova, Star
We have been continuing almost nightly spectroscopic observations of V339 Del (see ATel#5378)
with the 2.6 m Nordic Optical Telecope (NOT) FIbre-fed Echelle Spectrograph (FIES) (R ~ 67000),
the Ondrejov Observatory 2m Zeiss coude spectrograph (R = 18000), and a variety of grating
and echelle spectrographs of the ARAS group in the wavelength range 3684 – 7431A with
resolutions ranging from 580 – 12000. As noted by Munari et al. (ATel#5533), the ejecta
have now turned optically thin and entered the nebula phase but there are intriguing details.
The strong lines include: [O I] 6300,6364,8446A, [O II] 7320/7330A, [O III] 4363, 4959,
5007A, C II 7235A and [N II] 5755A (the 6548,6583A lines are still strongly blended with
Halpha), N II 4639, He I (especially 4471, 5876, and 7065), and He II 4686A (peak flux
5.9E-13 erg/s/cm^2/A on Oct. 28). He II was clearly present as early as Oct. 10 (but see
Woodward et al. ATel#5493). There is no further indication of either Na I D or any Fe II
(or related) emission in the spectrum. The line profiles remained nearly symmetrical and
identical to the [O I] 6300A, 6364A lines until Oct. 11. A drastic change in the Balmer
line profiles occurred between Oct. 12 (Day 59) and Oct. 14 (Day 61) — the interval from
-500 to -800 km/s increased by a factor of about 3 relative to the red wing (in the velocity
interval 500 to 800 km/s). This transition occurred around the time of the supersoft X-ray
detection (Osborne et al. ATel#5505). This same profile change was reproduced in all ionized
species lines, only the [O I] lines have remained unchanged.
On the Oct. 28 NOT spectrum (Day 76), comparisons of Hbeta and Hdelta reveals narrow
emission features with halfwidths of ~100 km/s throughout the profile, suggesting that
the broad emission is composed of individual knots with possibly low filling factor, the
same narrow features appear on [N II] 5755A. The [O III] 5007A line blue and red peaks
are at more negative (positive, respectively) velocities than Hbeta by ~150 km/s while
the FWZI is the same for both profiles; the same contrast is seen with respect to [N II]
5755A, which shows a weaker red peak (500-800 km/s) than Hbeta. The He I triplets show a
similar profile to Hbeta, the singlets (e.g., 5016A, 6678A) are either weak (showing only
the -500 to -800 km/s peak) or absent. To date (Nov. 5), there is no evidence of [Ar III]
7135A, [Fe VII] 6086A or any higher ionization emission lines. A weak continuum is
present, ~ 6E-14 erg/s/cm^2/A at 4000-7000A. At this point, the publicly available ARAS
archive contains more than 1000 spectra, many flux calibrated. Based, in part, on
observations made with the Nordic Optical Telescope, operated on the island of La Palma
jointly by Denmark, Finland, Iceland, Norway, and Sweden, in the Spanish Observatorio del
Roque de los Muchachos of the Instituto de Astrofisica de Canarias.ARAS database for Nova Del 2013
http://www.astrosurf.com/aras/Aras_DataBase/Novae/Nova-Del-2013.htmComparison of H beta and [OIII] 5007 with NOT

Nightsky 2013-11-05 09:17:59 30. oktober 2013 kl. 22:07 #109433Som svar til: V339 Del, NYT 29/10 – billeder af novaens ildkugle
Deltager- Neutron star
Data fra NOT 28. oktober
Steve Shore skriver:
The Hbeta profile is the key for the Balmer sequence and you see there are substantial
differences with Halpha. This is an ionization effect but I haven’t sorted out the details.
The Hgamma looks weird, and that’s another important indicator. It’s blended with the
[O III] 4363 line, the upper transition of the nebular triplet that gives a measure of
the electron density. The profiles for the [N II] and [O III] and He I lines are almost
the same, but the [O I] 6300, 6364 are showing a completely different, narrower, more
symmetric form so the ionization is clearly highly structures. Some of the features agree
but it’s formed in a more limited velocity range.So more will be coming but these are the first pass results. The photometric calibration
needs to be applied for secure scaling, the fluxes used a standard (BD+28d4211).The Balmer lines form NOT, note H gamma is blended with [O III] 4363

He II 4686 on the red edge of NIII and comparison with H beta profile (dashed line)
 29. oktober 2013 kl. 21:47 #109391
Som svar til: V339 Del, NYT 29/10 – billeder af novaens ildkugle
Deltager- Neutron star
Artikel #16
Steve ShoreSupersoft Røgnten
It’s been a long silence, and my apologies, but it doesn’t mean there’s nothing to write
about.As you may know from the ATels, V339 Del was detected as a supersoft source (SSS for short)
last week. To explain, this is when the ejecta are finally transparent in the high energy
range of about 100 eV to 1 keV. Even though this would usually be thought optically thin
because you’re talking about X-rays after all (Superman notwithstanding), hydrogen has an
enormous cross section at these wavelengths despite their distance in energy from the
ionization edge (13.6 eV, 912 A) since the absorption cross section changes relatively
slowly, by the inverse cube of the energy (so at 500 eV the cross section is lower by a
factor of about 50000 than at 14 eV but there is so much hydrogen that this can still be
opaque — the column densities are high). This doesn’t mean the source isn’t there, on
the contrary. As with the Fe curtain phase, this is when the effects of the XRs within
the ejecta are observable even though there is no direct detection of the white dwarf.
The SSS is, as you recall, the signature of continuing nuclear burning on the central
object after the explosion, when residual not ejected continues to process below the
photosphere. The high luminosities, this can be several thousand L_sun (hence enormous
fluxes), and low envelope mass (hence not an enormous in situ absorption) leads to a
photospheric temperature of a few 1^5K to 1E6 K for the duration of the event. The larger
the residual mass, the longer the source is active. Its turn-on is at the same time as
the explosion, but it remains like a covered “hot pile” until the ejecta finally thin out
sufficiently to see the WD directly. The rise observed by us, as external observers,
depends on the line of sight absorption, not the intrinsic absorption along a radial line
to the WD within the ejecta, so it’s possible to see the central star before the ejecta
are completely thin if the ejecta aren’t spherical (as is the case here). The slower rise
we see is just the unveiling of the source along out sightline.This is why I’d recommended noting if certain lines, formed in the ejecta at the periphery
— low density — are detected: [Fe VII] 6086 and [-Fe X] 6378. The latter is hard in low
resolution spectra since it’s blended with the O I 6364 line but it can show up. The former,
and [Ca V] 5307, are ideal optical indicators of the hot source but they have to be emitting
in those lines and, it seems from your latest set of spectra, that this in nova it isn’t. Yet.
They must be there eventually.The nova was behaving very well, for a degenerate, until a week ago when it went through
a massive (factor of 10) increase in XR brightness for a few days before returning to its
originally smooth rise. The spectrum also was temporarily very soft, meaning the range
around 500 eV. The source, according to the Swift data we’re collecting along with your
spectra, confirms the soft nature but the column density indicated in neutral hydrogen is
still an order of magnitude above the interstellar value. A minor mystery that, but the
flare is much more intriguing. When the nuclear source is active, it seems to be decidedly
unsteady, showing factor of 2 or so variability over hours to days.V339 Del is doing that. But such a singular brightening isn’t normal.
Whether it’s from the ejecta or the source depends on the radiative transfer. At this
point, I can’t give you an explanation other than a suggestion based on your spectra.
There’s been a dramatic shift in the structure of the line on the blueward side. This
significantly affects interpretation of the XR data since it’s the side of the ejecta
that shield the source. The rapid rise is likely the change in opacity in the UV of the
Lyman lines that have now allowed an increasing emptying of the lower level of H-alpha so
that side is completely optically thin. The red side of the profile hasn’t changed much
if you scale to flux (you can take the ratios of the profiles to see this in velocity).
If the change in the XRs is a transparency effect it occurred very quickly, in a few
days, and that indicates an electron density of about (3-4)E7/cm^3 for that portion of
the ejecta. This should have been seen in other lines and indeed it is — the He II 4686
shows the same (!) profile as H-beta and H-alpha (comparing data from Graham, Potter,
Buil, and Guarro). The low resolution data is ideal for showing the growth of the high
ionization species.If it’s an ionization event, a spurt of emission from the WD, this would produce an ionization
in the same timescale. So it will take a bit more work to give you a definitive answer
but the observations you’ve all accumulated are a goldmine, this is — yet again — a
stage not previously seen in this detail. And one more, important finding in your collective
spectra: He II 4686 IS there, despite the statement in the recent report, ATel #5493, that
it isn’t there. You see, those in the business can make some pretty egregious mistakes.
We are getting grating spectra with the UVOT on Swift that compare well with your low
dispersion data, in quality and time coverage, but in the IV (2000-4000A) so we will have
complete continua for this entire stage of the nova.The XR monitoring is continuing, there should be more very high resolution data when the
weather permits at La Palma from the NOT (they’ve had some bizarre humidity and wind in
the last few days, an observation on Friday failed) but as soon as it comes I’ll write
about it. There is an HST/STIS spectrum in the works for mid-November, this should be the
observation in the transition stage of the nova when the ejecta are free of the Fe curtain
and we will get the velocities and abundances for the ejecta for the first time. There
will also be an XMM/Newton XR spectrum at almost the same time (around 15 Nov). We are
now planning how to organize the first papers on this, I’ll keep you all informed; for
the first — including you all — we’ll use the spectra from the fireball and Fe-curtain,
possibly to the date of solar obscuration.
Links:
ATEL
http://www.astronomerstelegram.org/?read=5505Om Cross Section
http://en.wikipedia.org/wiki/Absorption_cross_section Illustration fra Mariko KATO (Keio Univ., Japan)
Online Presentations of the 2009 XMM-Newton Workshop, ‘Supersoft X-ray Sources – New Developments’,
ESAC, Madrid, Spain, 18th – 20th May 2009
http://xmm.esac.esa.int/external/xmm_science/workshops/2009_science/#presentationsLidt ekstra info:
Der kommer mere information I løbet af meget kort tid, skriver Steve.I går den 28. okt. fik de endelig gang i NOT’en spektra igen og de foreløbige data viser
definitivt ændringer i emissionen. Lige arbejdes der med data.Super spændende at amatører er med helt i front. Spektroskopi og amatører er det næste
store.Nova Del 2013 = V339
Novaen er pt. på et plateau hvor der ikke sker større ændringer i magnituden. 21. oktober 2013 kl. 00:34 #109000
Som svar til: V339 Del, NYT 29/10 – billeder af novaens ildkugle
Deltager- Neutron star
Vejret har ikke været med mig, så det er kun blevet til et forsøg på noget fotometri og lidt RGB.
En V og I optagelse gav en v-mag. på 10,9 for V339, med en usikkerhed omkring +-0,07 – Har ingen
anelse om hvorfor jeg ikke kan gøre det bedre, men mon ikke det skyldes et ringe S/N.Hvordan hulen jeg beregner i-mag. står hen i det uvisse. Hjælp modtages gerne.


På den store frame ses den planetariske tåge NGC 6905, fin i v men næsten usynlig i I


Et enkelt forsøg med noget RGB blev det også til, men resultatet blev ikke helt som forventet.

100% crop
33% sizeEn skam jeg ikke har fået lavet noget spektroskopi på den i nogle dage. Kontinuum er
droppet yderligt og nu står der kun klare emissionslinjer tilbage. Bl.a. Balmer linjerne
og noget OIII.Desuden viser det nyeste spektre også blåforskydning af bl.a. Ha og Hb. Er lidt spændt på hvordan
dette skal tolkes. -
ForfatterSøgeresultater